Greenwich - BUY/SELL trading indicator for Bitcoin & Сryptocurrency
By Yaroslav Krasko Updated November 21, 2022
BikoTrading Academy
Friends, the Bikotrading team has been working on a new product for a long time. A product that could solve the problems of many beginners and traders who are constantly looking for the perfect trading system.
KEY ISSUES:
- What is the Greenwich Indicator?
- How much can I earn with the Greenwich indicator?
- How to access the Greenwich indicator?
- Step-by-step Greenwich Instruction.
Most people who are just entering the cryptocurrency market try to find secret indicators, buy altcoins in the hope of earning hundreds of percent, start using huge leverage and as a result lose their time and money. Trading is not a lottery or a hope for good luck, trading is a clear set of rules that make up the trading system.
In this article, we will present you our Greenwich trading indicator, show statistics and tell you how to really earn $1 million.
Watch NOW on Youtube: The Greenwich indicator
What is the Greenwich trading system and how does it work?
Greenwich is a set of rules and market patterns statistically tested over a decade of bitcoin history and successfully tested over the past few years.
The indicator consists of long-term and medium-term strategies, which in combination bring extraordinary profits according to the results.
In order to better understand how the indicator works, let's look at bitcoin cycles. Bitcoin, like all world markets, has its cycles. On average, 1 cycle is 4 years, of which 2.5 years the market is in a bullish trend and 1.5 years it is in a bearish trend.

The main task of the long-term system is to find the market minimum and maximum.
And as you can see on the chart below, it does its job perfectly.

After the green diamonds appear on the chart, the indicator users need to buy bitcoins on their spot account, and as you have already understood, when the red diamonds appear, they need to sell.
Next, the medium-term strategy (blue areas) is activated, the main task of which is to increase the amount of bitcoins. As a result, we have a trading system that increases the number of bitcoins, while the price of bitcoin also increases.

You may have a question: what to do if you failed to buy on green diamonds? The answer is simple: open positions on medium-term signals (blue areas) and wait for green diamonds to take long-term spot positions on bitcoin. The results will be a little smaller, but you can still increase your capital considerably.
Over the entire history there were only 6 losing trades. The maximum loss was only 6%. Win rate of the strategy = 74%, which means that for every 4 trades 3 of them are profitable and only one losing. Profit factor = 19, which means that for every dollar you lose, you make $19 in profit. In the table below we have written out all the trade statistics.

According to statistics, the invested thousand dollars would turn into $ 4.6 million.
But of course, ten years ago no one could have predicted such a growth result, so below we will consider the trades for 2015-2017 and 2019-2021.
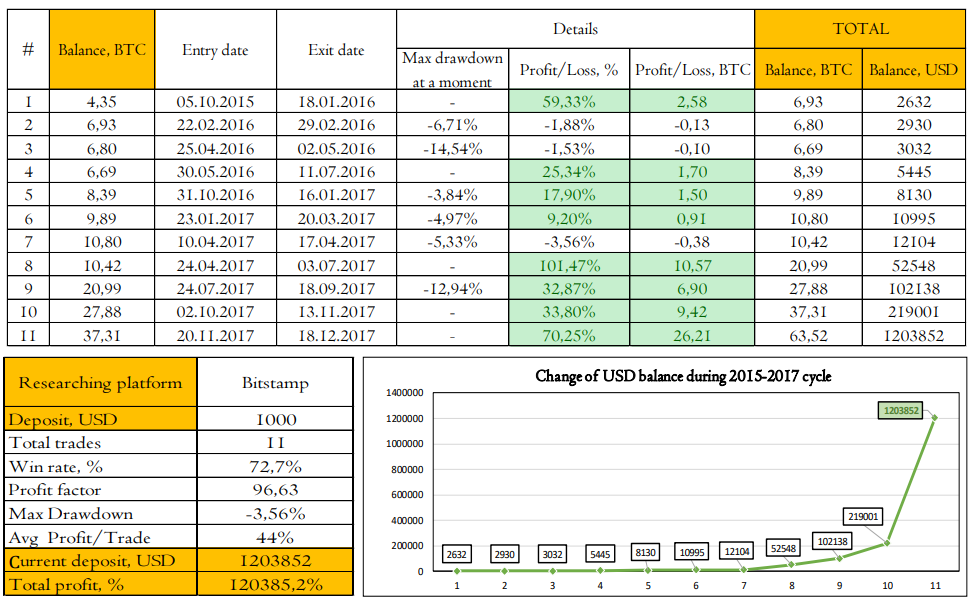
The table and chart below show all the trades from 2015 through 2017. Let's look at an example: in 2015, you wanted to invest $1,000 and use the Greenwich strategy. At that time, 1 bitcoin was worth $230, so you bought 4.35 bitcoins on a Buy signal. After that, on each medium-term strategy signal (blue area) you leveraged 1x on your bitcoin and increased the number of bitcoins. As a result, in just 11 trades, your 4 BTC increased to 64 BTC, and the price of BTC increased from $230 to $17,000. Thus, you earned $1.2 million in 2 years by investing only $1k. It sounds unrealistic, but it is.

Of course, you can say that in 2015 few people were interested in cryptocurrency, so let's consider 2019 - 2021 when everyone already knew what bitcoin was.

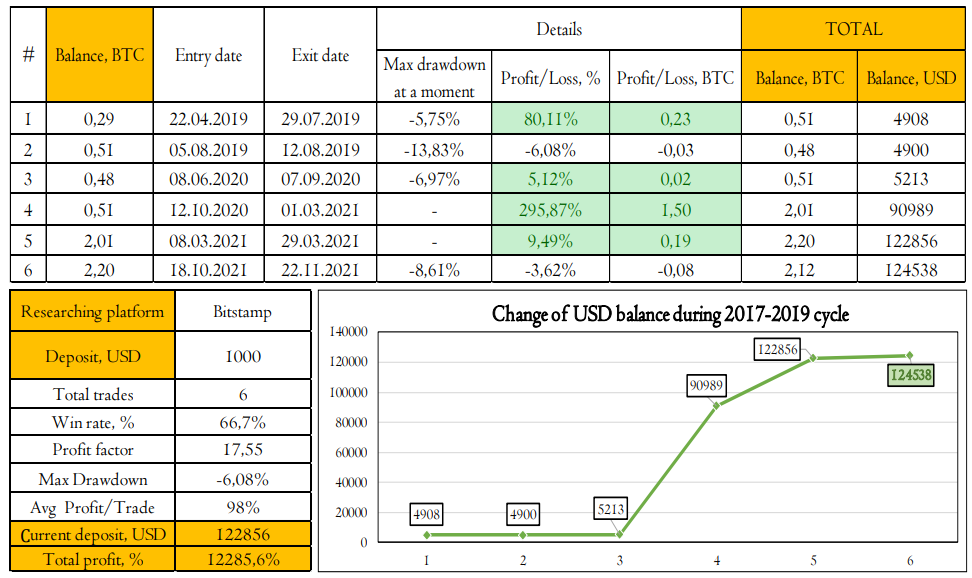
The signal to buy BTC appeared at $3.200, we bought 0.29 BTC for $1 thousand. After that there were 6 trades, with the help of which we increased our bitcoins from 0.29 BTC to 2.12 BTC. And that's $120k with only $1k invested. 120x profit. You can also use the system to buy altcoins. The bull market isn't over yet and this result can increase 5-10 times more.
Now back to the question 'How can I become a millionaire with the Greenwich Indicator? According to our predictions, analyzing real facts and statistics in the next cycle, there is an opportunity to increase your capital by 100x. Having 10 thousand dollars you can really become a millionaire, but if you start now even 1 thousand dollars may be enough to get full financial freedom.
How to get access and open the Greenwich indicators?
First, you need to gain access to the system, which you can do by filling out the form at this link. After that, our manager will get in touch with you.
1.Register on the TradingView
2.Send us your nickname

3.If you have been granted access, go to the CHART section

4.Open a BTC / USD trading pair on the BITSTAMP exchange (this exchange has a long history of bitcoin, so it is important to choose it for the correct operation of the indicator, you can open trades on any exchange !!!)

5.Once the chart is open, select the weekly timeframe (this is necessary because the algorithms work only on this timeframe)

6.Next, at the bottom of the chart, select the logarithmic display of the chart.

7.The chart has been set up, now go to the Indicators tab, on this tab you will have a section - Invite-only scripts, go to this section, it will display an indicator called Biko, Click on it!

8. That's it, the indicator should open on your chart and be ready to use.

For comfortable use, we recommend using a candlestick display of the price.

Instructions for the Greenwich trading system
What do the indicator symbols mean?
- green diamonds, the symbol indicates that the price has reached the bottom of the market and this is the best time to buy bitcoin on a spot account.
- red diamonds signal the end of the trend, or the beginning of a strong correction.

- the white area at the top roughly indicates the maximum of the market, and signals that you need to prepare for the end of the bullish market (the indicator has a purely informational function)

- the white area at the bottom indicates the market minimum and signals that now is the best time to buy altcoins and bitcoin.

- blue area (opening a futures position with leverage)

How to use the Greenwich trading system?
There are two ways to trade on the Greenwich system.
In order to better understand the work of the trading system, we want to show you this chart. Bitcoin cyclicity chart. Bitcoin moves in cycles. The cycle lasts about 4 years, of which 1.5 years are in decline and 2.5 years in the growth phase.
The essence of the system that brings superprofits is that we increase the number of bitcoins, while we also earn on the growth of bitcoin itself.
The Greenwich trading system consists of 2 strategies and a large amount of supporting data:
- the aim of the first strategy is to identify the bottom and maximum of the cycle.
- he aim of the second strategy is to increase the number of bitcoins.
As a result, we get double the profit.
The first and most profitable way to use the system, if you managed to buy at the bottom of the market (with the appearance of green diamonds)
Let's look at a real example, and show how you could increase your capital 136 times in the last 2 years, and how to do it now. As an example, let's take 1 thousand dollars.

Signal (green diamond)
After the weekly candle is closed (UTC: 00:00 weekly candle closing time) and the signal remains on the chart, you have to buy bitcoin on your spot account.
We buy bitcoins in the amount of $1 000
Price - $ 3200
1 thousand dollars = 0.31btc
We have bought bitcoin on our spot account, and we are waiting for signals of a medium-term strategy by which we will increase our number of bitcoins.

A blue area appears on the chart, signaling to open a leverage position.
Once the weekly candle has closed (UTC: 00:00 weekly candle closing time) and the blue area remains on the chart, you should open the leverage position. We will send video and text instructions on how to open a futures position with leverage on the Binance coin-m account.
We open a futures position on the coin-m account with 1x leverage
Price - $ 5300

We held the position for 14 weeks. At the close of the weekly candle, the signal disappeared and we closed our futures position.
Our profit was + 80%.
We had 0.31 btc, add our profit + 80% = 0.56 btc
As a result, we have more btc and the price of bitcoin has increased from 3.2 thousand dollars to 9.5 thousand dollars.
Now our balance is = 0.56 btc x $ 9,500 = $ 5,300
Our $ 1,000 turned into $ 5,300
We are waiting for a new signal

The next trade, we open and close on the same principle.
Our loss was - 5.97%
Our balance: 0.56 btc - 5.97% = 0.53 btc

Then the signal (green diamonds) reappeared on the chart. Another good option if you have not been able to open spot positions.

The next trade
Our profit was + 5.19%
Our balance: 0.53 btc + 5.19% = 0.56 btc

The next trade
Our profit was + 297%
Our balance: 0.56 btc + 297% = 2.22 btc

The next trade
Our profit was + 9.5%
Our balance: 2.22 btc + 9.5% = 2.43 btc

A red diamond appeared on the chart at $ 56,000, signaling to fix the positions and sell bitcoins and altcoins to stablecoins (usdt, usd, busd, usdc, etc.).
That is what we did:
- invested $ 1k and bought 0.31 btc on the signal (green diamond)
- using the system increased the number of btc from 0.31 to 2.43
- on the red diamond signal ($ 56,000) sold all our btc and alts
- 2.43 btx x 56,000 $ = 136 thousand dollars (136x)As a result, by investing $ 1k and opening only 7 trades, we made money - $136 000
The second way, if you failed to buy at the bottom of the market (with the appearance of green diamonds)
If you failed to buy bitcoin on the spot when green diamonds appear, you can open regular futures and margin positions when blue areas appear (for example on a regular Binance account USDT - M).
Let's look at the situation, there is a blue area on the chart, this is a signal to open a position with the leverage.
Once the weekly candle has closed (UTC: 00:00 weekly candle closing time) and the blue area remains on the chart, you should open the futures usdt-m position with leverage 2x.
On the chart, we noted one of our last positions, which brought 300% profit. Since we used leverage our result is about 600%.
Most likely, the bull market is not over and according to many models, the maximum market is at 140 - 200 thousand dollars. Therefore, with this system you can get up to 700% of potential profits, successfully reach the end of the bullish market, save your results and get new signals to buy!


.png)