ATAS BookMAP (DOM Levels) Tutorial for Crypto Traders
By Yuriy Bishko June 03, 2025
10+ years in crypto trading and investing, in asset management since 2019, co-founder of BikoTrading.
Developed personal highly profitable swing and scalping strategies for the crypto market.
KEY ISSUES:
While many traders rely solely on indicators or price action, more advanced traders are diving into order flow analysis to gain a real edge. In this tutorial, we’ll explore how to use DOM Levels in the ATAS trading platform – a powerful alternative to the traditional BookMAP – to boost your trade timing, confirmation, and confidence.

What are the DOM levels in ATAS?
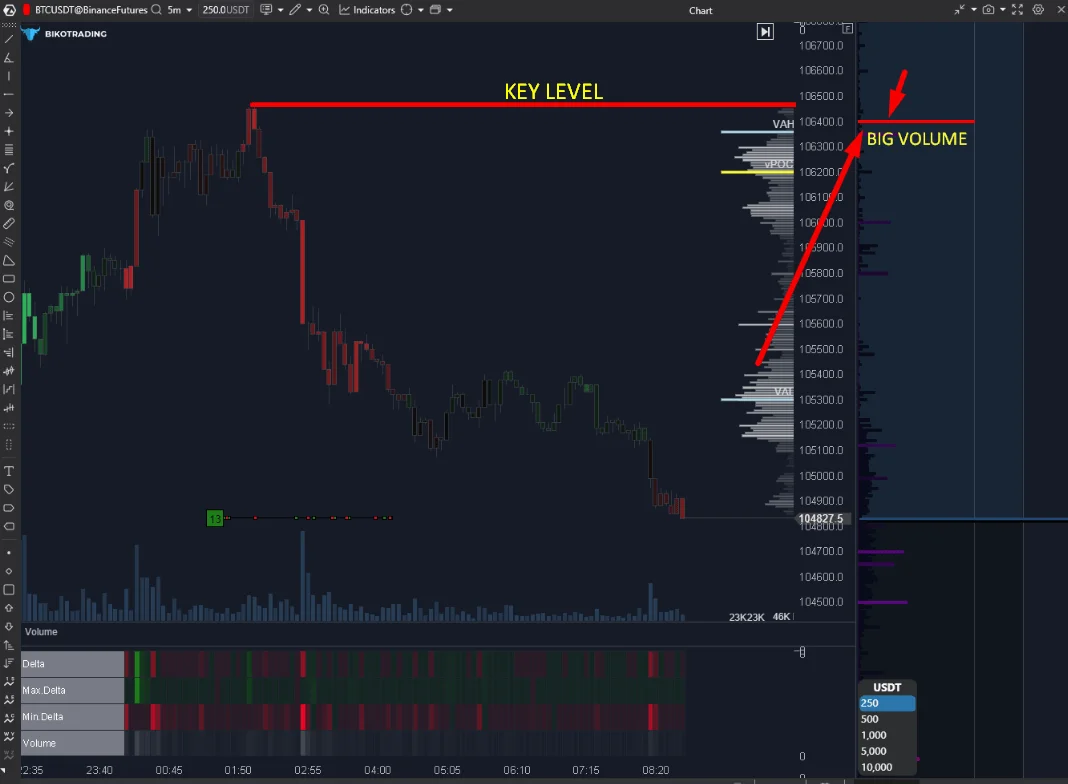
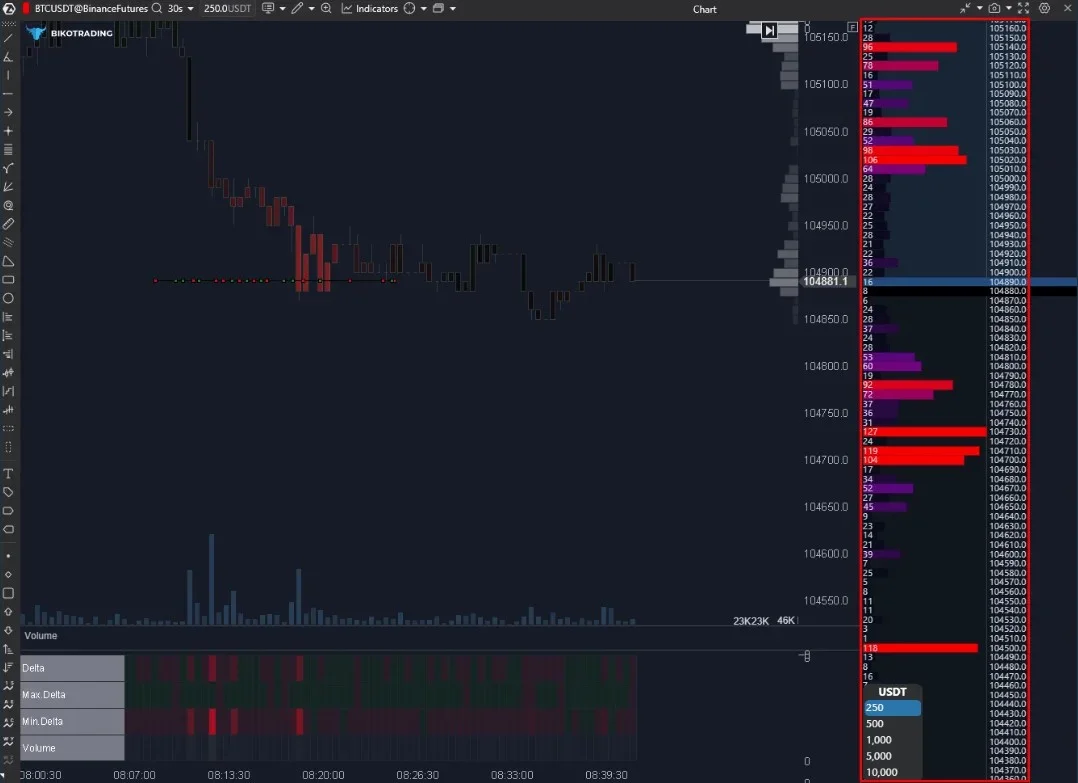
DOM Levels (Depth of Market Levels) represent real-time limit orders placed on the DOM trading platform. These levels show where liquidity is sitting – buy and sell walls that can act as potential support and resistance zones.
In platforms like BookMAP, these are visualized through heatmaps. In ATAS, you can achieve the same (or even better) functionality by using the DOM Trader module with the Order Flow Liquidity Map and placing DOM Levels directly on your chart. This gives you an edge – you can visually align these levels with your chart analysis. We have prepared a notebook of DOM reading level approach.
How to Set Up DOM Levels in ATAS
- Open ATAS.
- Launch the DOM Trader module.
- Activate the Order Flow Liquidity Map to see where high-volume limit orders are located.
- Overlay DOM Levels on your chart.
- Add VWAP, Delta, and Volume Profile to provide contextual confirmation.
Now, instead of scanning heatmaps in a separate window, you're seeing actual liquidity levels on your trading chart – a big upgrade in terms of usability.

Why DOM Levels Matter for Crypto Traders
Real-Time Market Intent
ATAS DOM Levels provide a live view into the true intentions of market participants, particularly institutional traders and whales. These are not just historical support/resistance levels or abstract indicator values – they are actual limit orders sitting in the order book, showing exactly where buyers and sellers are planning to enter or exit the market.
For example, if a massive buy wall appears at a certain price level, it often signals that a large player wants to accumulate at that zone. This could either slow down a downtrend or act as a springboard for a reversal – if you know how to read it in real time.
Dynamic Support & Resistance Levels
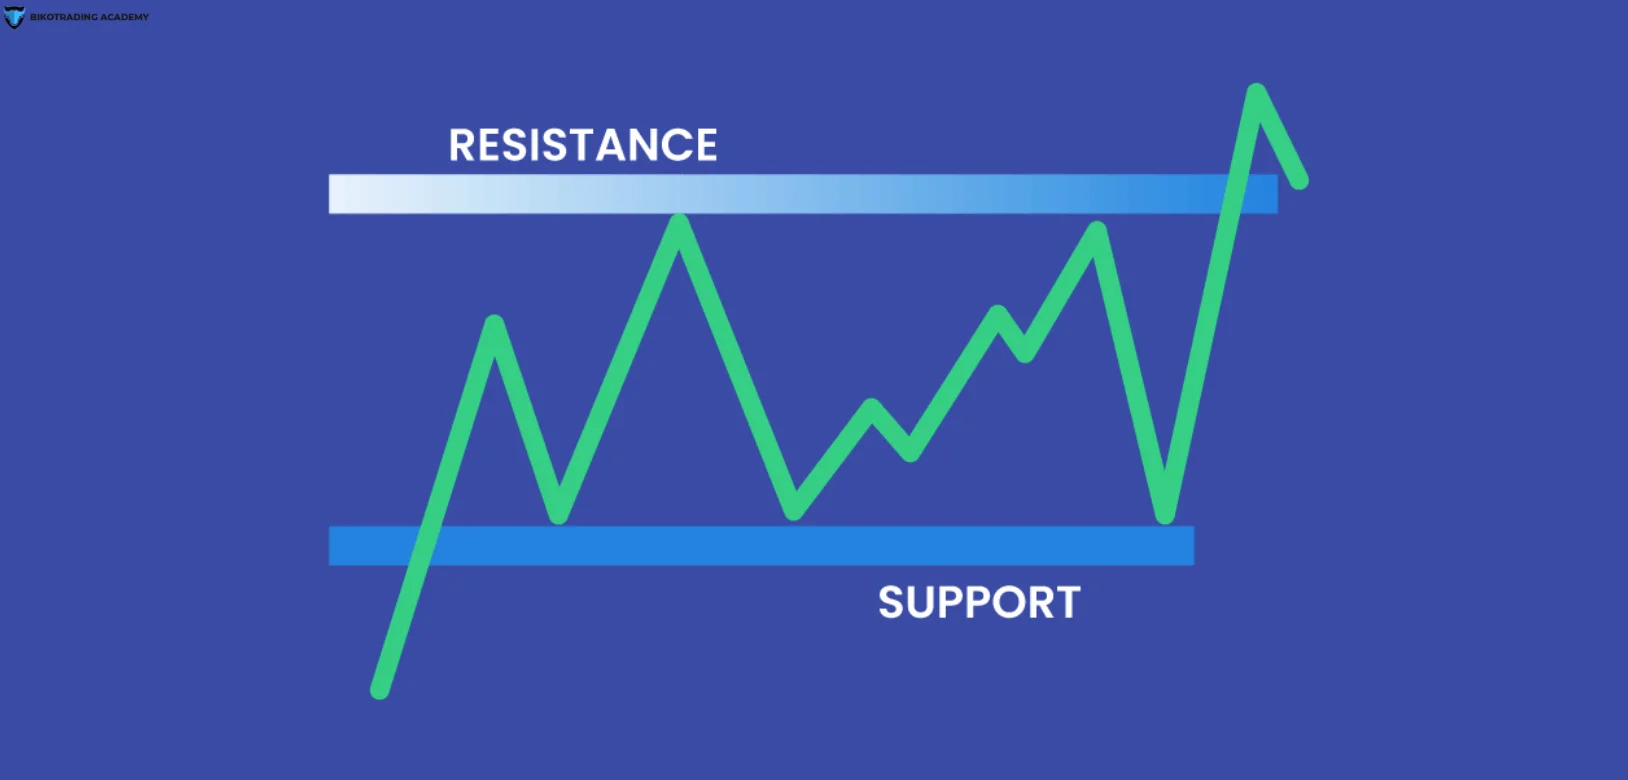
Traditional support and resistance zones are often drawn from past price action — swing highs, lows, or psychological round numbers. While useful, they are static and can become outdated quickly in fast-moving crypto markets.
DOM Levels, by contrast, are dynamic and real-time. They constantly reflect the current state of liquidity on the exchange. As market participants update or cancel their orders, levels in DOM in trading adjust instantly, providing a more responsive and adaptive view of the market. This allows you to identify zones where the price is more likely to stall, reverse, or accelerate, not based on guesswork, but on actual supply and demand visible in the order book.
Precision Confirmation for Entries and Exits
DOM Levels truly shine when used in confluence with other professional tools like VWAP , Delta, and Volume Profile/Market Structure. When price approaches a key DOM Level that aligns with a VWAP deviation or Point of Control, and you see aggressive Delta confirming absorption or breakout, it becomes a high-probability trade setup.
Rather than blindly entering trades based on indicators, DOM Levels let you fine-tune your entries to the tick, placing your orders exactly where large interest is sitting and managing your exits with greater clarity. They also help you filter out false signals by showing when liquidity is pulled or when a level has no follow-through after being tested.
How to Use DOM Levels Effectively
Let’s break down a few real-market examples using Bitcoin to show how DOM Levels help with entries, pullbacks, and trend confirmation.
Watch our video or keep reading to get our best advice on how to trade efficiently with DOM Levels.
- Key Reversal Zones with Delta Absorption
One of the most powerful setups using DOM Levels is spotting potential reversals at key market zones — particularly when combined with Delta absorption. Imagine Bitcoin approaching the previous day’s high, a classic area where many traders expect resistance. As price nears this level, a significant limit sell order appears on the DOM Level, signaling that a large player is looking to offload a sizable position. Meanwhile, aggressive buyers continue to push the price higher, but their effort is absorbed — visible in the Delta chart as heavy buying that doesn’t move the price upward.
This combination of a key price level, visible liquidity, and Delta absorption creates a highly reliable reversal signal. DOM Levels are most effective when they act as a trigger within a broader market context — especially around daily highs or lows — and are validated by order flow behavior such as absorption.
- Break and Retest of Liquidity Levels
Another highly effective use of DOM Levels is during breakout and retest scenarios, where former resistance becomes support. In this setup, price approaches a significant DOM Level where a large buy wall has been sitting. When price breaks through this wall with strong positive Delta, it’s a signal that not only has the liquidity been absorbed, but buyers are now in control. This breakout often represents a shift in market sentiment or a continuation of an emerging trend.
What makes this setup powerful is the retest that follows. After the breakout, price pulls back and revisits the DOM Level that was just broken. If the level holds — meaning there’s no aggressive selling, or the pullback is met with fresh buying interest — it acts as a new support zone. This retest provides a low-risk, high-reward entry point for traders looking to align with the trend. In this case, the level held firmly, and price bounced strongly, continuing the uptrend. Once a DOM Level is broken with confirmation from Delta and volume, it often transforms into a reliable support or resistance level on the next interaction.
- False Liquidity Signals
One common trap traders fall into is reacting too quickly to flash liquidity — a scenario where a large DOM Level suddenly appears, giving the illusion of strong interest at a particular price level. However, these orders often get canceled before price interacts with them, or they were never intended to be filled in the first place. This tactic, known as spoofing, is sometimes used by larger players to manipulate short-term price behavior or mislead less experienced traders.
In these cases, price either fails to bounce from the supposed support or resistance zone, or worse, reverses sharply in the opposite direction, leading to false signals and potential losses. The critical lesson is that DOM Levels alone are not enough — they must be confirmed by actual market behavior. Look for signs of execution or absorption through Delta spikes, volume surges, or visible reactions on the footprint chart.
- VWAP and DOM Level Confluence
Some of the highest-probability trade setups occur when DOM Levels align with key volume-based indicators, such as VWAP (Volume-Weighted Average Price) and its deviation zones. In this scenario, price is observed consolidating within the 0.5 VWAP deviation range, a zone often associated with fair value or balance. During this period, a significant DOM Level is broken, indicating that previously stacked liquidity has been absorbed, and then the price pulls back to retest the same level.
What validates the move is the Delta confirmation, showing a burst of aggressive buying activity during or just after the retest. This combination of a VWAP deviation, DOM Level support, and positive order flow creates a powerful confluence that often leads to a strong trend continuation. When these factors align, it suggests not just interest, but commitment from large players. The key takeaway here is that DOM Levels located around VWAP deviations or Points of Control are not just static liquidity zones – they become strategic entry points when validated by volume and market structure.
Bikotrading Academy offers comprehensive training on order flow trading ATAS designed to give you a strong foundation and the confidence to navigate the crypto market effectively.
Here’s what you’ll gain from the course:
- A clear understanding of market mechanics and price movement principles
- Proven trading strategies tailored for crypto markets
- Guidance on identifying optimal trade entry and exit points
- Practical tools and DOM trading strategies used by professional traders
- Guidance on DOM trading software and its best practices
- Support in building your personalized trading plan
- Free access to our private trading club, where you can exchange insights, get support from our ATAS trader community, and stay updated with real-time market analysis
Join the Bikotrading Academy and learn how to analyze charts accurately, develop a winning strategy, and trade with confidence in any market conditions.

Best Practices for Using DOM Levels
To get the most out of DOM Levels, it’s important to use them in combination with broader market context. On their own, they’re just snapshots of order book activity — but when paired with solid technical structure, they become powerful tools.
- Start by combining DOM Levels with market structure elements like key support/resistance zones, trend lines, and areas of supply and demand. These provide the framework, while DOM Levels help you time entries with precision.
- For even better accuracy, add tools like VWAP, Delta, and the Volume Profile into your workflow. These give you the context, showing where value is, where volume is building, and how aggressive the buyers or sellers are. DOM Levels then act as the final confirmation or trigger for your trade and may become the best DOM for trading for you.
- Always remember: don’t act on DOM Levels alone. Watch how price behaves when it reaches them. Are orders being absorbed? Is there a surge in Delta or a strong reaction on the footprint chart? These signs tell you whether the level is likely to hold or fail.
- Lastly, while DOM Levels are primarily intraday tools, it helps to zoom out. Use higher time frames like the 1-hour or 4-hour charts to align your trades with the bigger trend. This added context can significantly boost your confidence and win rate.

Conclusion
DOM Levels in the ATAS trading software give you deep insights into market behavior, allowing you to spot smart money moves before they’re visible on a traditional chart. But they must be used with a proper market structure and context. Just like any pro-level tool, DOM trading requires practice and discipline. But once mastered, they become a high-precision confirmation tool that enhances your existing strategy, especially in volatile crypto markets.

