Bollinger Bands indicator. How does it work? How to use it?
By Yuriy Bishko October 18, 2024
9+ years of experience in trading and investing in the cryptocurrency market
Co-founder of BikoTrading
Developed personal highly profitable swing and scalping strategies for the cryptocurrency market
Engaged in asset management since 2019
KEY ISSUES:
Bollinger Bands (BB) is a popular technical indicator that displays current price deviations and is used even on Wall Street. It measures volatility and provides a large amount of information for making profitable decisions on the sale and purchase of financial assets.
The Bollinger Bands indicator was invented by technical analyst, scientist, and trader John Bollinger, who later wrote the bestselling book Bollinger on Bollinger Bands, which was translated into 11 languages and awarded dozens of financial prizes. In 1996, John created the first American website dedicated to technical analysis, and now he is the owner of Bollinger Capital Management Inc, a financial company that uses the methods he developed.
MACD (Moving Average Convergence Divergence) is an indicator of the correlation between two moving averages. It determines the strength of a trend and possible reversal points. Its main focus is trend assessment. You can combine MACD with Bolinger Bands to achieve more accurate data and get more information about the real situation on the market.
RSI (Relative Strength Index) is an indicator that measures the speed of price movement. RSI shows when a trend is oversold and when it is overbought, and it can suggest the ideal time to buy and sell cryptocurrencies. Trading with Bolinger Bands becomes more effective when the indicator is combined with other technical analysis methods such as RSI or MACD to confirm trends.
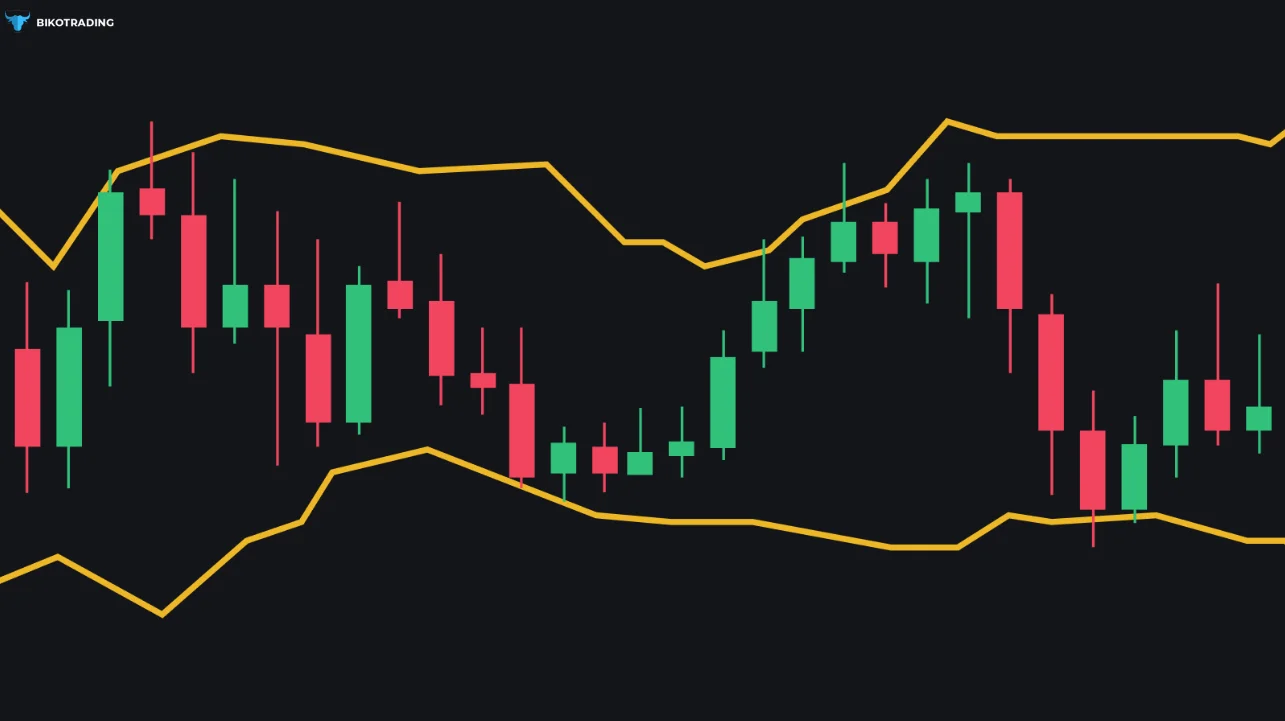
Bollinger Band definition says that the indicator measures how much prices fluctuate over time (market volatility). If the upper and lower bands are widening, prices are fluctuating very much, and when they are narrowing, the market is calm.
MACD is more about trend analysis. Unlike MACD, Bollinger Bands help to understand whether the market is volatile. And RSI is an indicator for assessing the strength and speed of price movement. You can use MACD, Bollinger Bands, and rsi together.

The Bollinger Bands strategy helps to determine how prices are positioned relative to the normal trading interval. But how is a Bolinger Band calculated? It is graphically represented by three bands.
The bands create a corridor within which prices are considered normal. The indicator is based on the standard deviation or standard deviation. The indicator is calculated based on the standard deviation from a simple moving average (SMA) with a default period of 20. Bollinger Band settings for a 1-min chart can vary, but traders usually use settings with a period of 20 and a deviation of 2 for more accurate short-term signals.
The Bollinger Bands indicator allows you to assess whether an instrument is overbought or oversold right on the price chart, taking into account the amplitude of fluctuations. Let’s study the formula for Bolinger Bands.
The indicator consists of three lines:
- The middle line of bolinger band (SMA) is a simple moving average of the price for a certain period (Middle Line (ML) = Moving Average (SMA (Close, N)))
- The lower line is the middle line minus two standard deviations (Lower Band = ML - (D x Standard Deviation))
- The upper line is the middle line plus two standard deviations (Upper Band = ML + (D x Standard Deviation))
D is the deviation coefficient set in the terminal settings.
Standard Deviation (StdDev) – standard deviation calculated by the formula:
SQRT (Sum (Close, n)) ^ 2, n)/n), where
- Sum – the sum over n periods.
- SQRT is the square root,
- Close – the closing price,
- n – calculation period.
The indicator has several tasks:
First, Bollinger Bands demonstrates market volatility.
Secondly, the lines form a channel in which the price moves.
Thirdly, it is used as a dynamic resistance and support line.
Reading charts and working with the Bollinger Bands strategy is quite simple. If the price is close to the upper band, the market is most likely overbought. This means that a price drop can be expected in the near future.
If the price is closer to the lower band, the price may start to rise, as this is a sign of oversold. If you correctly define, what is low Bollinger Band, you can easily find a support level where the price can temporarily stabilize before a possible reversal.
But narrowing bands are a signal that the market will soon become more volatile, meaning there will be a strong upward or downward movement in the price.
For a more accurate analysis, traders customize Bolinger Band setting levels by adjusting the period and deviation depending on the selected timeframe and market conditions.
If you are planning to draw a chart, remember the main bollinger bands parameters: about 95% of prices should be within the lines, and 5% should go beyond them. Sometimes the price has to touch the boundaries of the band, and this is normal. And if there is a sharp movement in the market (for example, due to some news event), it is possible that the chart may briefly go beyond the bounding lines.
Your first task in the analysis process is to choose a strategy. To do this, you need to determine what phase the price is in: whether it is going down, up, or consolidating. Bollinger Bands also help to look for divergence.
Bollinger Bands can be used on most timeframes – daily, minute, daily, etc. If you want to know how to use Bolinger Bands, crypto traders usually use it for working on short timeframes. It helps to earn a small profit in quick trades on the rebound from the upper or lower band. For scalping, it is important to set more sensitive parameters (smaller standard deviations, shorter periods).
The market is in balance and positions are accumulated when the lines are horizontal and the lines are within the lower and upper limits. In this case, a trader can work from the upper to the lower line and ignore the center line. This is possible if the corridor is not too narrow, the price can move in the opposite direction.
Here is a short Bollinger Bands tutorial for you:
- Assess the trend that precedes this corridor and work towards it. If you see an uptrend at the entrance to the corridor, work from the lower boundary.
- The direction of the trend is determined by the position of the price chart relative to the middle line.
- A weak trend is indicated by a consolidation under the middle line.
- Identifying what is a Bolinger Band divergence which occurs when the price of an asset moves in one direction and the indicator shows an opposite trend, will help to indicate a possible trend reversal. The divergence of the corridor borders indicates the continuation of the trend.
- If the borders narrow, it signals a possible trend reversal and decline.
- A decline in volatility is usually indicated by sharp price changes after the band narrows.
- A possible trend reversal can be predicted if peaks and troughs outside the band are followed by peaks and troughs inside the band.
- If price movement is observed from one of the borders, it is likely to continue to the other.
- A price exit from the narrow band downwards gives a signal to sell, and upwards – to buy, while a return to the narrow range indicates the need to close positions.
We recommend using Bollinger Bands to anyone who plans to make money on cryptocurrencies. Many trading platforms offer Bolinger Bands online, which allows traders to use this indicator in real time to monitor the market. The indicator is easy to use, it can be used on any financial market, and it can be applied as part of a strategy or trend following strategy.
However, if you are looking for guidance on setting a stop loss, or want to maximize your earnings on cryptocurrencies, read Bikotrading articles and learn additional tools: for example, our own indicator for cryptocurrency trading, Pump Tracker.
It's interesting and useful.


