Why won't you be a profitable crypto trader without DOM and Footprint?
By Yuriy Bishko Updated November 08, 2022
BikoTrading Academy
No market participant will argue with the fact that the price moves from liquidity to liquidity. In simple words, from volume to volume. That is, the main element that controls the price is the volume. But if you ask 100 traders whether they analyze volume, only a few will answer that they do. No wonder why only 5-10% of traders earn money in the market.
Key points
- Why is it important to analyze trading volume?
- What is the DOM and Footprint?
- How to trade with the DOM and Footprint?
What is the advantage of using DOM and Footprint in trading?
Knowing how to identify levels, patterns of technical analysis and even using basic trading strategies is not enough to start making money. Trading based on simple technical analysis, without analysis of trading volume, is simply the same as running blindfolded. You seem to feel the ground under your feet, and even hear what is happening around you, but in which direction you need to move, you do not fully understand.
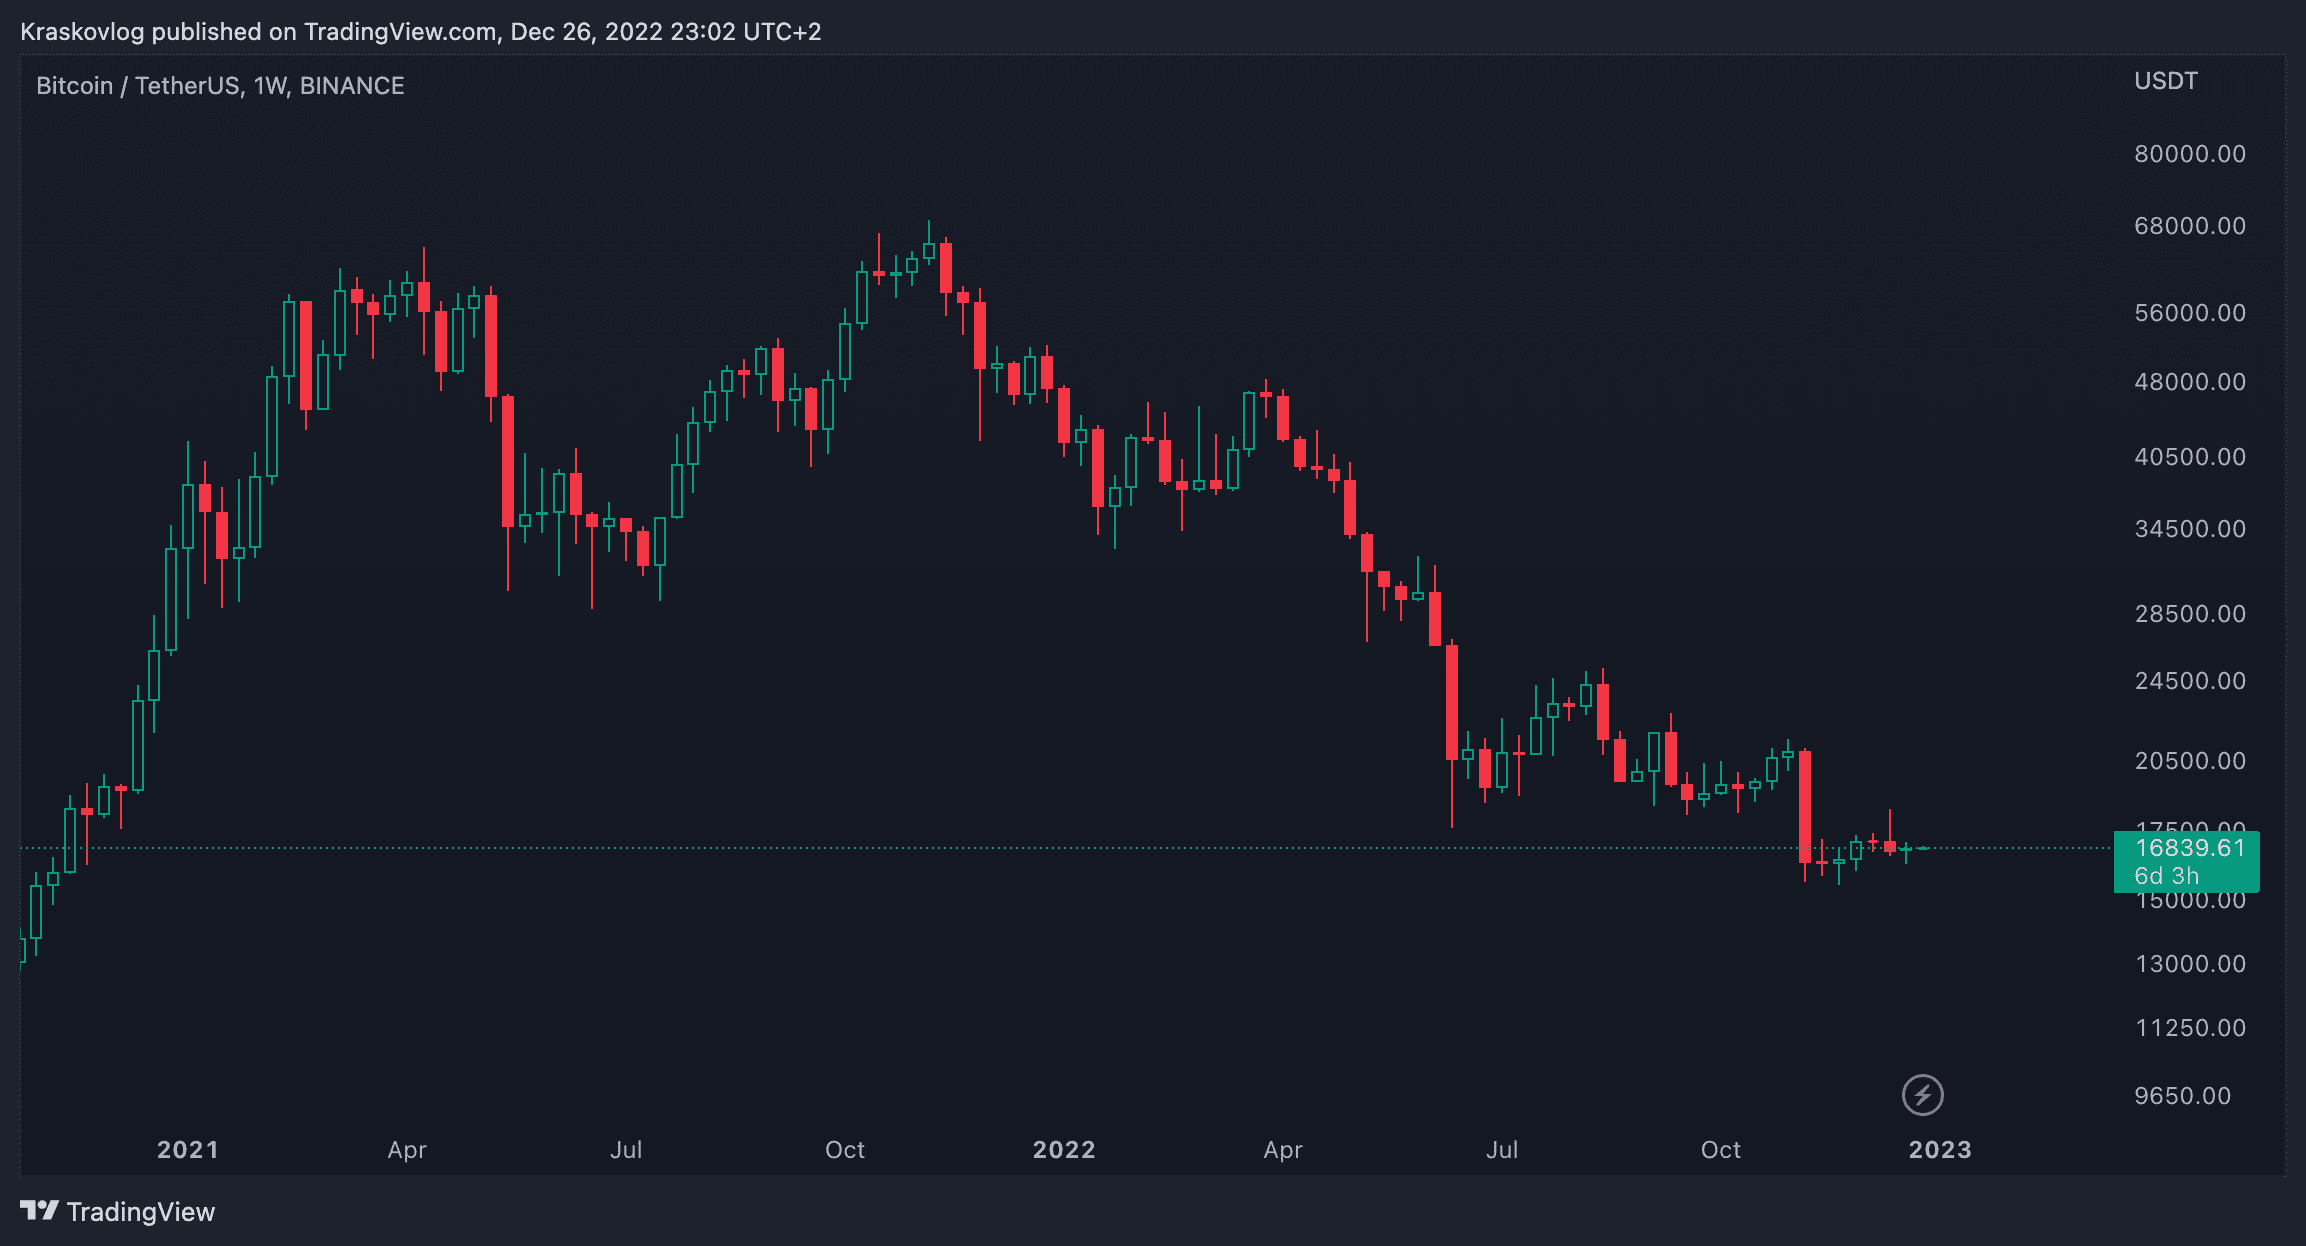
An example of what a trader who analyzes only chart price structures sees in front of him.
And here is an example of what a trader who additionally analyzes the volume of the price sees.
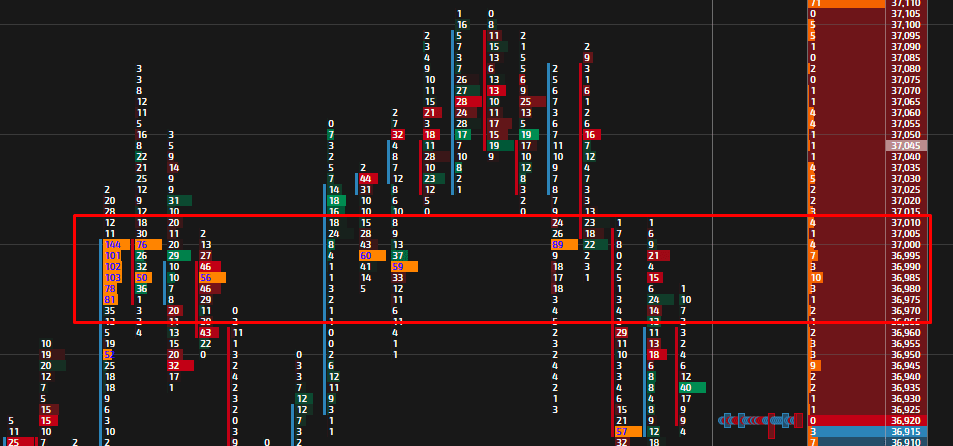
That is, we clearly see the difference. In the first case, all the trader can analyze is the price chart. In the second case, the trader clearly determines where exactly the volume for buying and selling is, at what price and what amount of cryptocurrencies has been sold or bought, where liquidation levels are located, etc. Of course, a trader who additionally analyzes the trading volume has a complete advantage over a trader who uses the usual, traditional analysis of chart structures. We can analyze the volume using the DOM and Footprint.
What is the DOM and Footprint in trading?
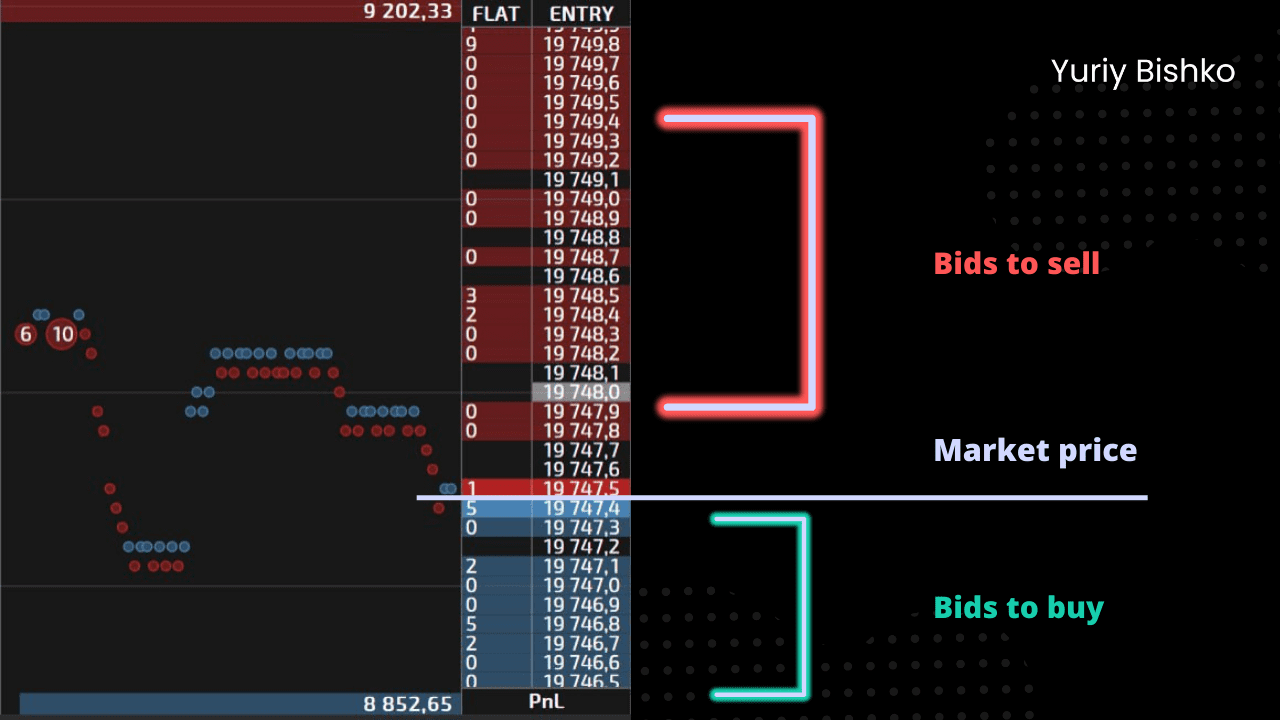
DOM is an online panel that displays orders to buy and sell cryptocurrency. With this panel, we can track large orders, predict future price direction, and open trades with greater accuracy.
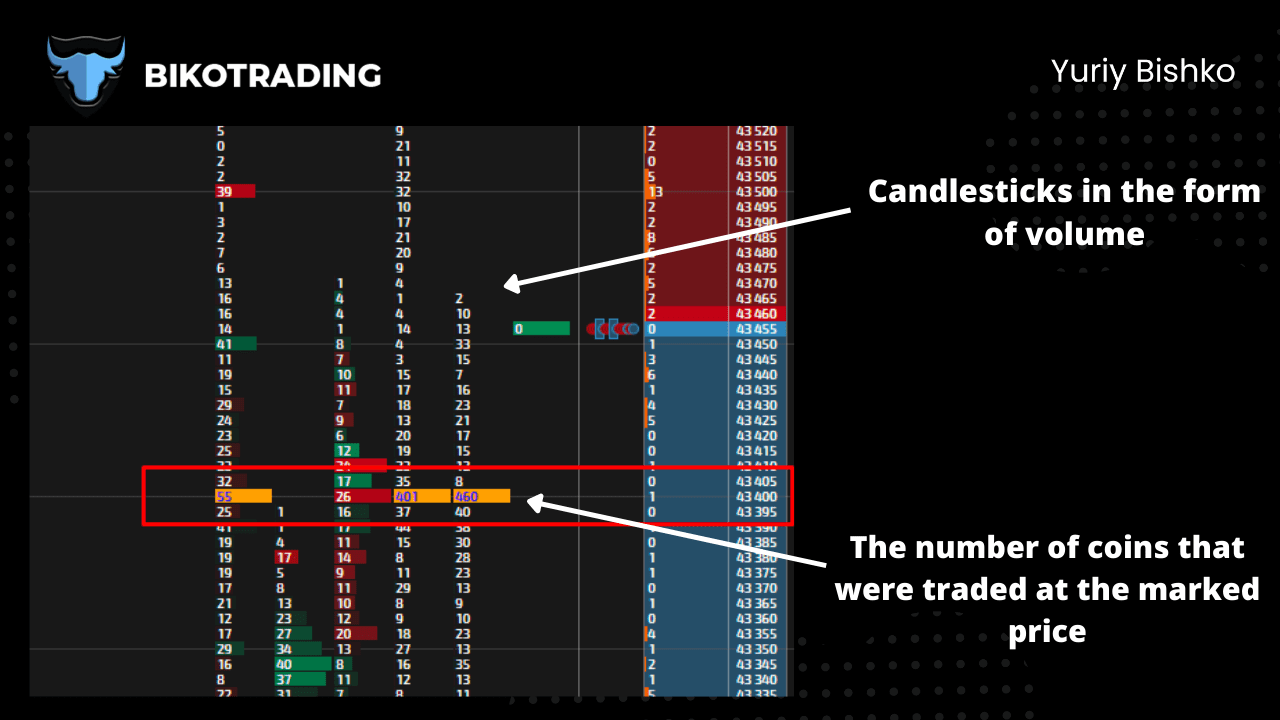
Footprint is an electronic book in which all executed trades are automatically entered, as well as all detailed information: number of coins, price, time, etc. In the screenshot below, an example of how exactly we analyze the traded volume in the order book. We analyze trading candles in the form of volume. This is a very detailed type of analysis called cluster analysis. With the help of cluster analysis, we can determine very precisely how many coins were traded and in which place which is more likely to give us an opportunity to predict the direction of the price.
How to trade with the help of the DOM and Footprint
There are different options for trading using the DOM and Footprint. Some traders identify large orders in the DOM and open trades to rebound from the volume in an opportunity to quickly catch the price movement. Other traders expect a large accumulated volume in the Footprint. For example, 1000 - 2000 bitcoins in the Footprint can direct the price by 5-10%. Watch the video below on how to trade using the DOM and Footprint.
WATCH NOW: This Scalping Strategy Will Make You Millions
WATCH NOW: DOM & Footprint LIVE BTC Scalping Session | $442 of Profit within 2 hours
Programs for volume analysis, read in this article.
Summary
Markets are changing, if 10 years ago you could open trades with the level breakout and make money from it, with mass availability it has become simply impossible. Big players understand very well that a large amount of liquidity can be collected at trial levels and very often use this for their own purposes. That is why you can get up to 5-8 stop orders and only then the price will go in your direction. If you don’t want this to happen, you need to be ahead and constantly adapt to changes. Volume, DOM and Footprint, this is a new reality without which successful trading is simply impossible.

