ATAS – a free scalping program with DOM and Footprint indicators
By Yuriy Bishko Updated December 19, 2022
BikoTrading Academy
Today you will learn more about Footprint and DOM indicators, where you can download them for free and how to use them, as well as understand how to configure these indicators.
KEY ISSUES:
- ATAS: a platform for order book and footprint data analysis
- Downloading and configuring ATAS: instructions
- Examples of using DOM and Footprint indicators
ATAS – a free program with Footprint and DOM indicators
It is known that to analyze DOM and Footprint indicators you need programs to see the volume in trading or programs for scalping. There are both free and paid utilities, one of which will be described below.
One of the best programs to analyze DOM and Footprint indicators is ATAS. What is ATAS? ATAS is a professional trading and analytical platform designed to analyze current and past orders. The software contains everything you need to quickly and efficiently assess the market: a user-friendly interface, DOM and Footprint indicators and tracking of HFT algorithms. The platform accumulates data from such exchanges as Binance, Bybit, FTX, Bitfinex, Bitmex, Bittrex, Bitget and others and is completely FREE. Yes, you do not need any API keys, licenses or subscriptions: just download the software to your Windows and start using it!
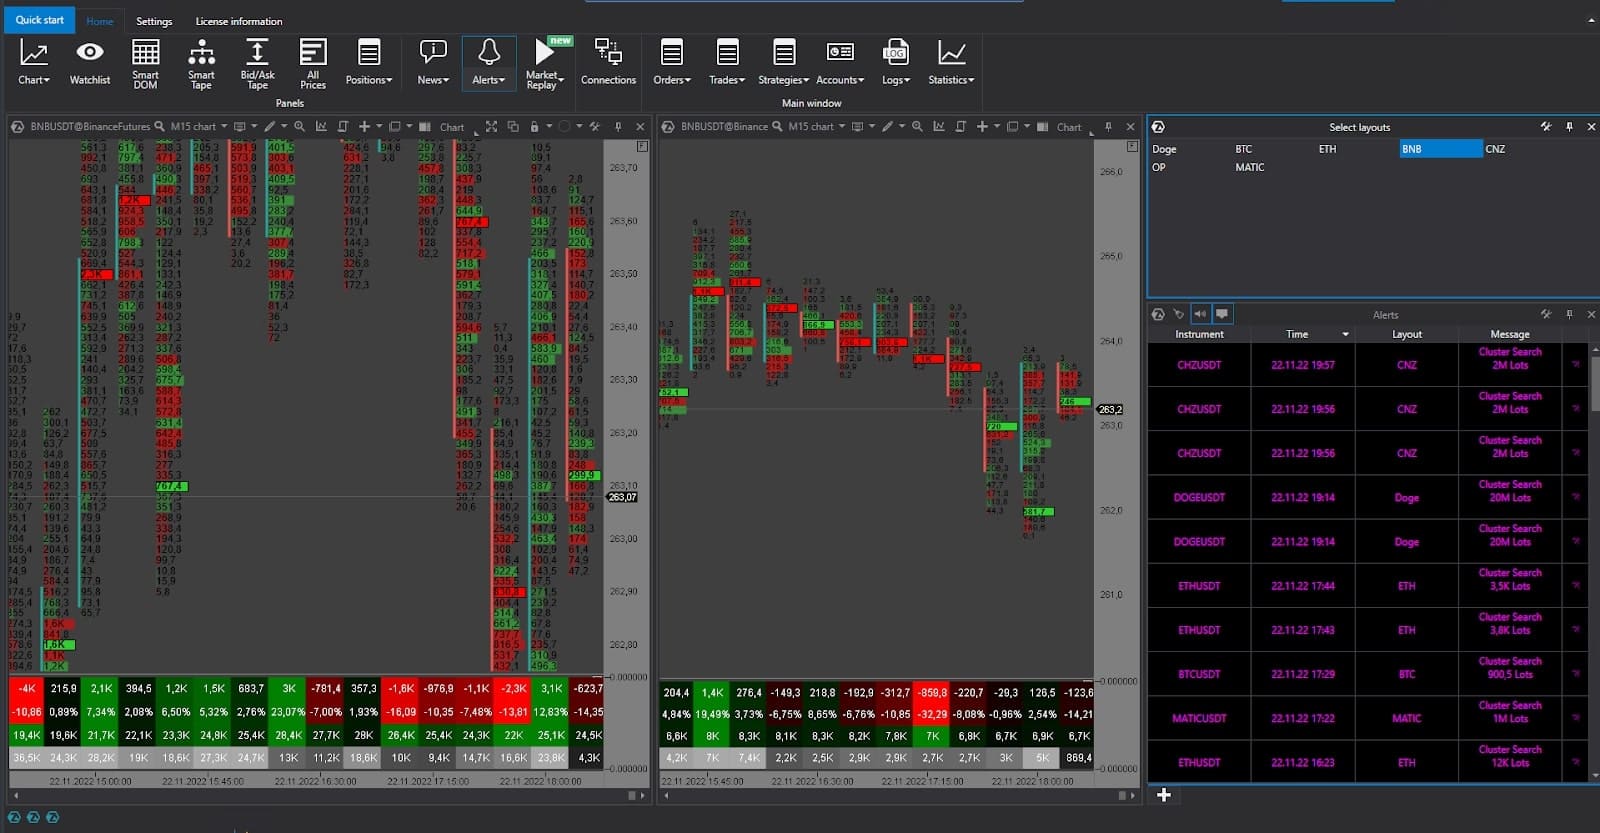
The ATAS trading platform is:
- High-speed connection to leading crypto exchanges without delays and freezes;
- Saving real account data on users' PCs for security;
- 14 types of charts;
- 400+ cluster display options;
- 240+ indicators for volume analysis;
- Access to your own analysis history.
By installing the software at the link above, you will receive powerful custom indicators as a gift, created personally by the BikoTrading team! Our development will help you not only to analyze the market qualitatively, but also to conclude only profitable deals.
Exchanges for scalping
Here is the question: which exchanges to use to view the volume data? In this case, it is necessary to use the most popular exchanges that occupy most of the market. The exchange with the largest trading volumes is currently Binance. As of today, the volume of derivatives in it for one day alone is $19 billion, which makes the platform the leader of the cryptocurrency niche. Due to such volumes, Binance has a strong influence on all futures markets, which is so important for traders, and therefore it is necessary to analyze the Footprint and DOM indicators taking into account Binance data. Given this, the analysis of indicators without Binance data will be ineffective, and therefore its connection to ATAS software and the use of Binance data is the key to success.
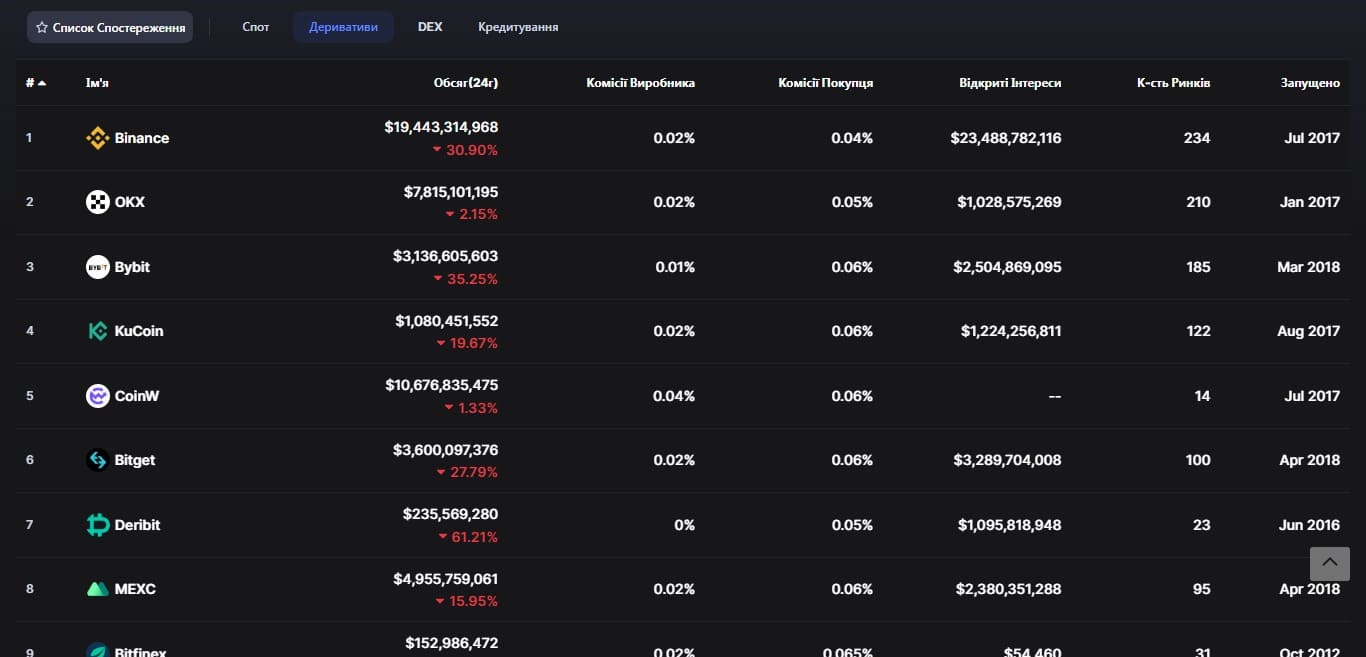
Despite the fact that Binance data analysis is a necessity, you can still trade on any other exchange or platform that is convenient for you. Yes, some people in different countries of the world do not have access to this exchange, and therefore the question arises in choosing another, no less popular and large platform. This is the ByBIt exchange, and you can sign up for it using this link.
How to use ATAS?
First you need to install the program on your PC or laptop. To do this, use the link and click on Try now. After installing the utility, you will need the ATAS instruction, which we have published below:
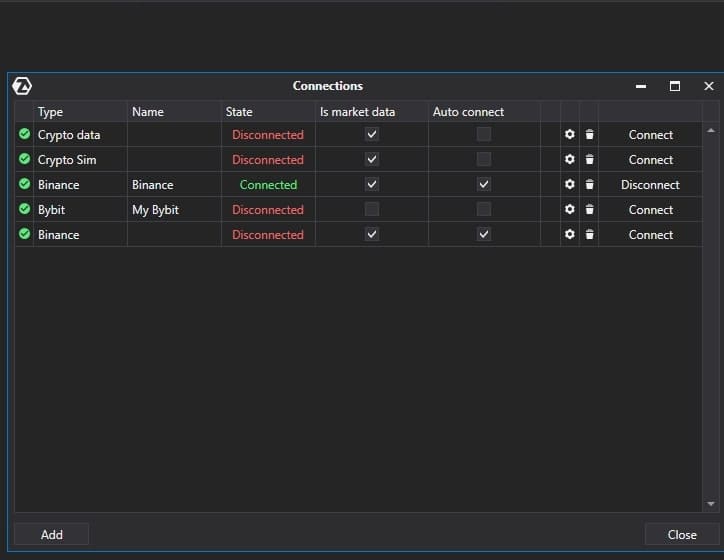
Step 1. Open the app, click on the Home button and then on Connections. In this section you can connect your accounts on other exchanges, for example, your account from Binance. Please note that even without connecting accounts, data for footprint and other indicators will still be downloaded.
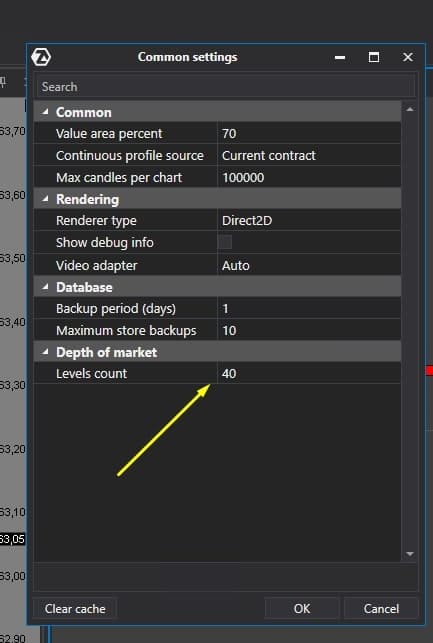
Step 2. Next, go to Settings, and in the column that appears, click on Common Settings. Find the Levels Count section, opposite which the number 100 is indicated, and replace it with 0. This is necessary in order to see all the data in the footprint and remove the limits for the DOM.
Done, now the question of how to connect to ATAS will no longer hinder you!
What is Footprint and DOM?
What is Footprint? Footprint is an indicator that shows past executed orders to sell and buy a certain cryptocurrency, as well as the volume of these orders and the price at which the asset was bought/sold.
What is DOM in trading? DOM (Depth of Market) is an indicator that allows you to see all available limit orders on the market for buying/selling cryptocurrency.
If you compare both indicators, it becomes clear that Footprint shows only past, executed trades, while DOM displays current, not yet activated orders. These indicators are used in pairs to obtain confirmation of your own observations and analysis, and the process itself is called cluster analysis.
What is cluster analysis in trading? This is the analysis of the volume profile of each candle on the chart on the selected timeframe. This method of technical analysis allows to:
- Identify resistance and support levels;
- Understand the market sentiment (bullish or bearish);
- Build a strategy taking into account volume trades and the reaction of the cryptocurrency price to them.
Examples of Footprint and DOM application
To understand how these indicators help to analyze the market and open a profitable trade based on the data obtained, let's look at a few examples.
Footprint. Let's open a footprint for the DOGE/USDT pair:
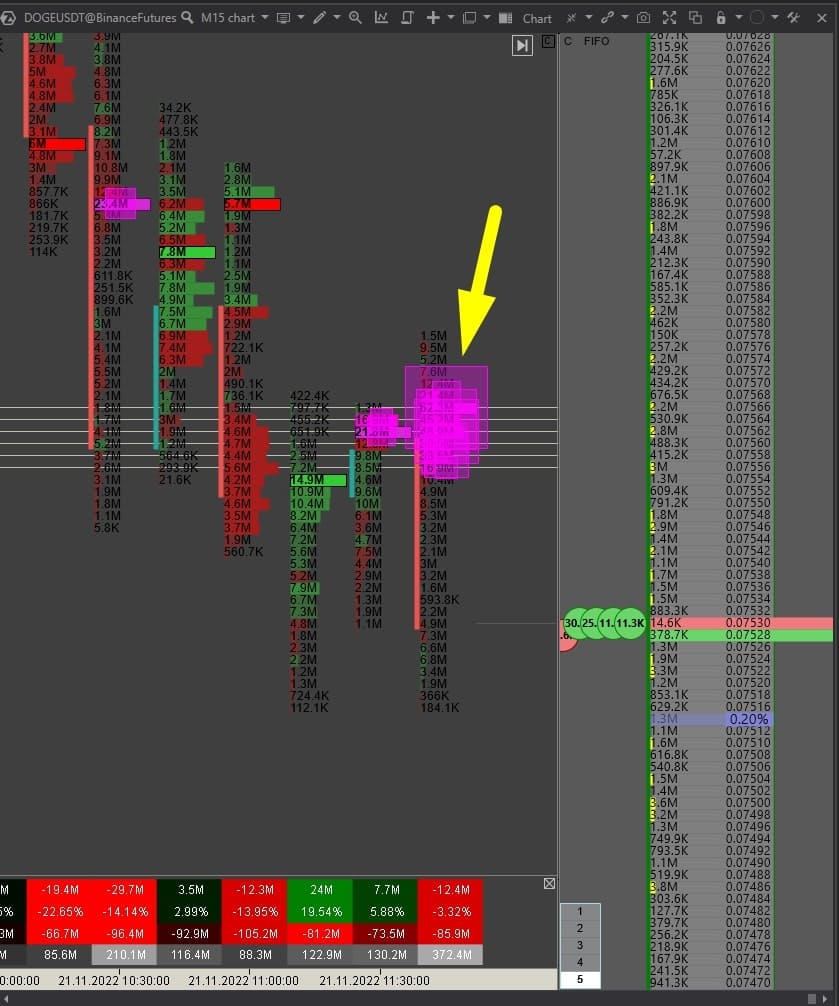
As you can see from the chart, in one small range there are deals for the sale of the asset for a total amount of 255 million Dogecoins, which is a large volume that will greatly affect the market as a result. To analyze the impact of these orders on cryptocurrency quotes, we open the usual chart of the pair:
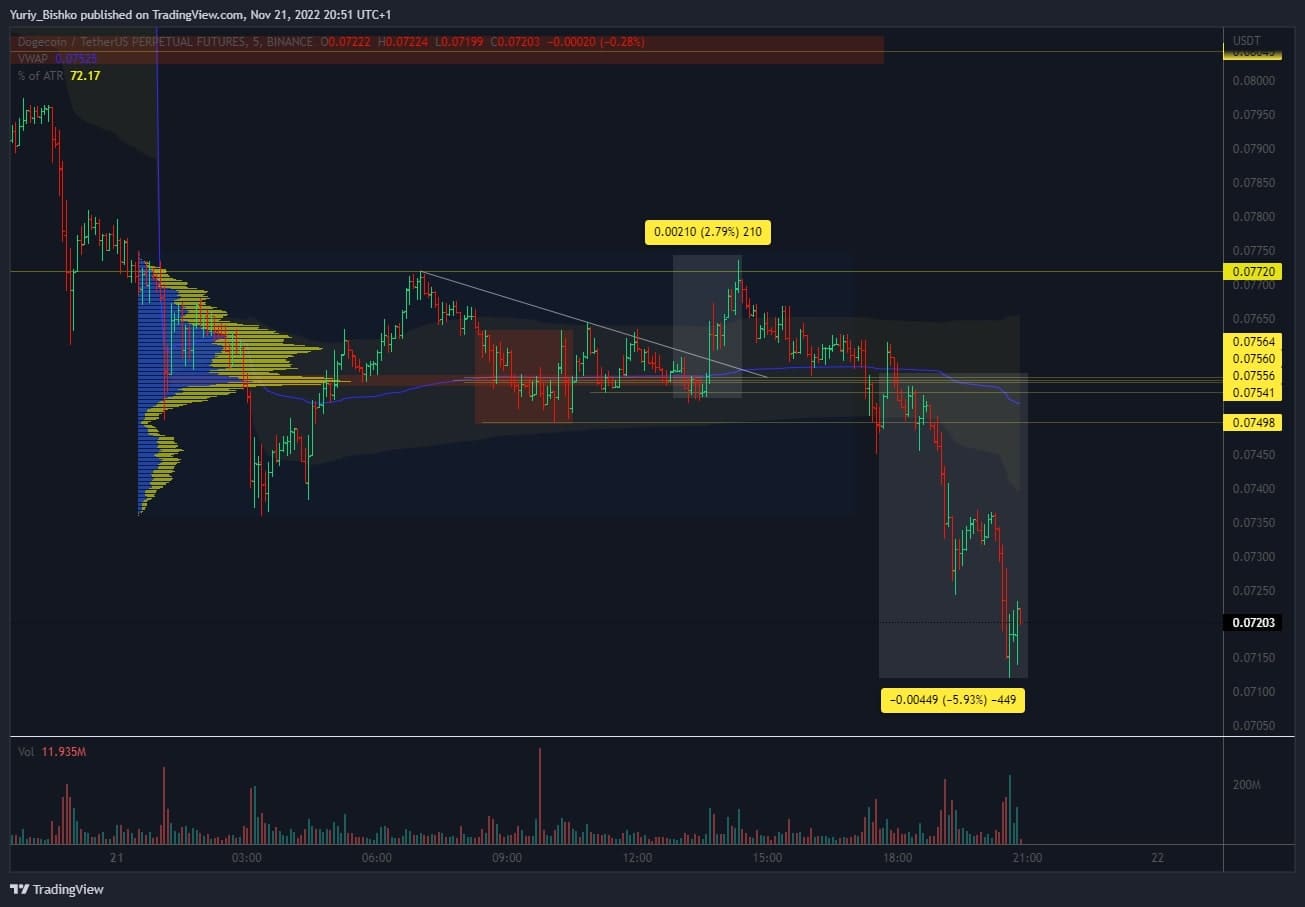
From the image, it is noticeable that a large volume of trades was reflected in the volume indicator, and at the point of the chart above it, a retest of this volume began, which as a result for a short time became a strong level of support for the coin quotes. During this period, the pair's price rose by 2.79%, but after the volume broke down, it became a strong resistance level, which resulted in a 5.9% drop in the pair's value. Conclusion: large orders to sell cryptocurrency cause its price to fall, and to buy - its value to grow.
DOM. Let's consider an example for the FIL/USDT pair by opening the order feed data for it:
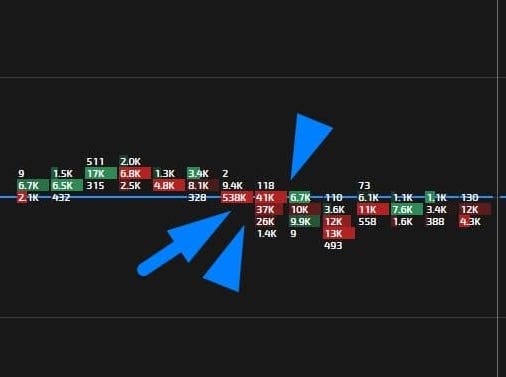
Looking at the chart, we notice a large application for the purchase of cryptocurrency in the amount of 538 thousand coins. In total, over a short period, trades to buy a pair worth more than $3.3 million were executed. To analyze the current situation, we use the DOM indicator:
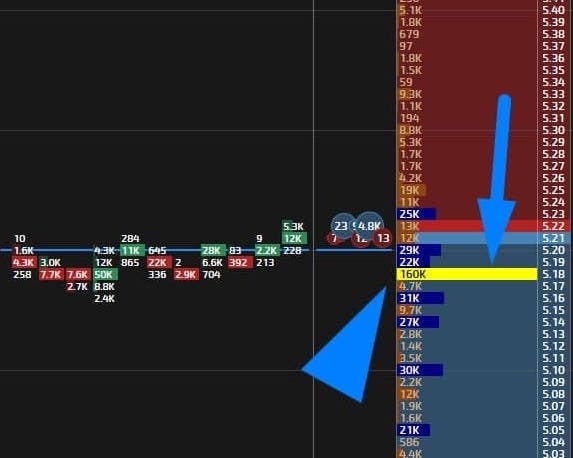
As can be seen from the order book, there is a limit order to buy the FIL/USDT pair in the amount of 160 thousand coins. A little later, another large order of 93 thousand units of cryptocurrency appears:
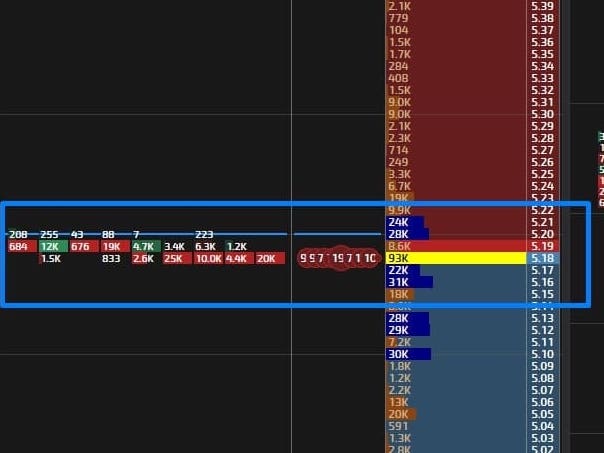
These orders were quickly reflected in the pair's order feed, where at one point orders to buy a pair worth 165 thousand coins appeared:
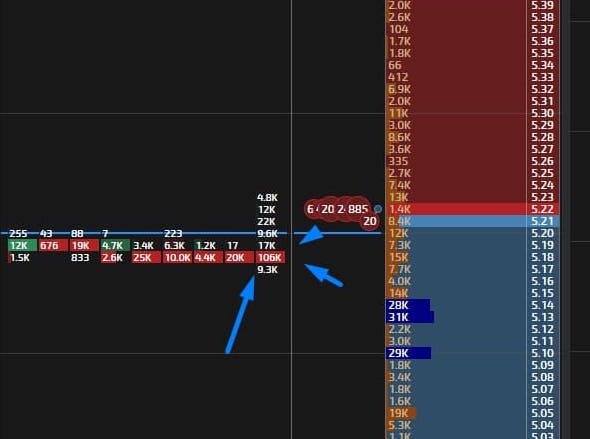
Don't miss this opportunity to open a long position for FIL/USDT and watch the chart move.
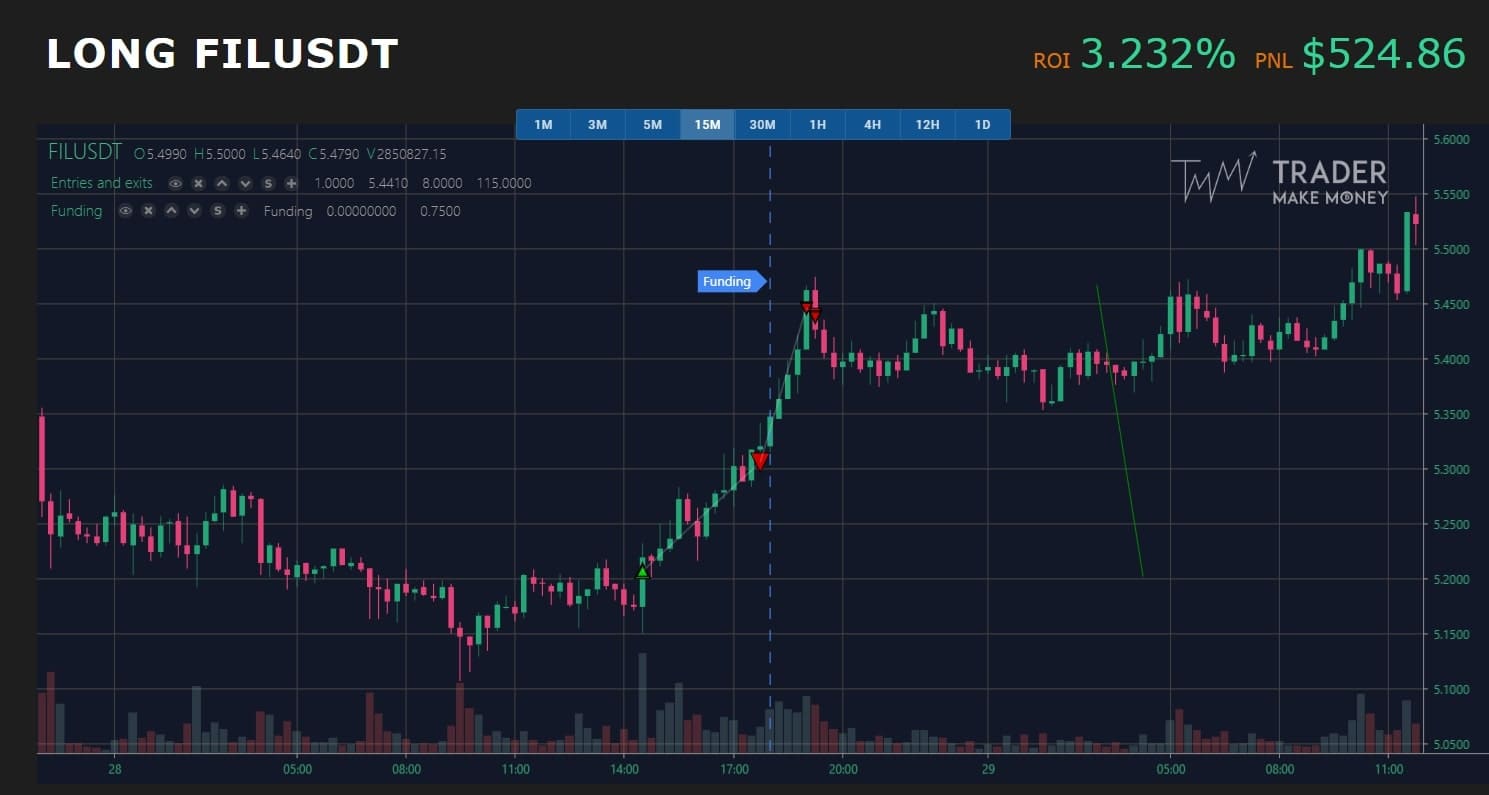
Due to the successful opening of the trade, we managed to earn $524 in a short period of time with an ROI of 3.2% and an initial investment of $100. As you can see on the chart, the price first made a false breakout of the trend, and then rapidly rushed upwards. In our case, we closed the trade when the price reached $5.4, but the quotes continued to grow further, reaching a value of $5.5. Thus, the analysis of the DOM indicator helped us to assess the situation and make the right forecast, which resulted in profit.
Conclusion
Cluster analysis is a great way to analyze market volumes, determine the general trend and support and resistance levels. The main indicators used in the analysis are Footprint and DOM. To use these indicators effectively, use the free ATAS program by downloading it from the link below.
If you want to analyze the cases of using the indicators in detail and learn how to analyze the trend with their help, we recommend you to sign up for our mini-course, where we will share step-by-step instructions and life hacks on how to analyze the market with Footprint and DOM indicators.
We hope our article will help you to become a successful trader and get a cool profit!

