How to find liquidity/reversal zones on CME indices using Order Flow?
By Yuriy Bishko January 31, 2025
10+ years in crypto trading and investing, in asset management since 2019, co-founder of BikoTrading.
Developed personal highly profitable swing and scalping strategies for the crypto market.
KEY ISSUES:
The high CME volatility indices open up numerous opportunities for traders, but effective trading requires a deep understanding of price dynamics. One of the most powerful methods of analysis is Order Flow, which allows you to track the activity of market participants in real time. In this article, we will look at how crypto traders can use Order Flow to identify liquidity zones and reversals when trading on CME, as well as provide practical recommendations for effective trading.
Why are CME indices important for crypto traders?
The CME (Chicago Mercantile Exchange) is one of the leading markets for futures trading, including indices such as the S&P 500, Nasdaq, and Dow Jones. These indices often correlate with the dynamics of crypto markets, especially during high volatility. Understanding the liquidity zones on the indices can help predict the price movements of cryptocurrencies.
How to find liquidity zones using Order Flow
1. Liquidity Accumulation
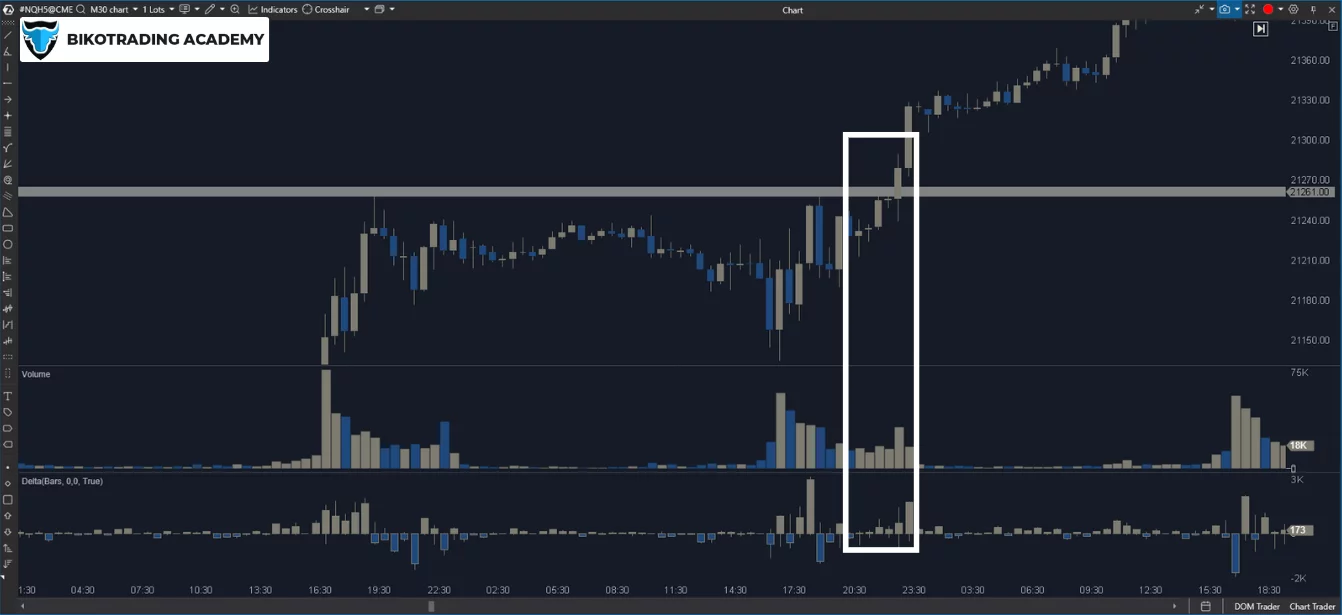
Use the Footprint Chart to analyze volumes and liquidity order flow. Find the levels at which the largest volume of deals was executed. Trading liquidity zones involves analyzing key levels where high volumes of trades occur. Often, prices with high volumes become strong support or resistance zones.
For example: if you see that the Bid and Ask volumes were high at a certain level for the S&P 500, this could be a signal of an important zone.

Pay attention to the Liquidity Map. With this CME liquidity tool, look for “hot” levels where large limit orders to buy or sell are concentrated. Red levels indicate areas where sellers can stop the price from moving up, and green levels indicate places where buyers can try to protect their positions.
2. Delta Divergence
Delta reflects the difference between aggressive buy and sell orders. Its divergence from the price can signal strong liquidity zones.

A positive delta when the price is falling means that large buyers are “absorbing” the supply, paving the way for a reversal. A negative delta when the price is rising indicates that traders are selling into an uptrend, which may indicate a potential end to the movement.
For example, if the price is falling, but the delta remains positive, this indicates active buyer interest. You can expect a rebound or even a reversal.
3. Stop Orders
Stop Order is an example of the liquidity zone indicator. The price sharply breaks through a key level, stop losses are triggered, and then the price goes back down. This is a classic technique used by market makers to collect liquidity. Pay attention to the Volume Spike during the breakout of the level.
If after the Stop Run the price returns above the level from which the breakout occurred, it may be a signal to enter in the direction of reversal.

4. POC (Point of Control)
POC is the price at which the largest volume of trades was executed during a certain trading period. It acts as a magnet for the price.
If the price is far from the POC, but the trading volume is falling, there is a high probability that the price will return to this level. For example, if the POC is at the same level and the price has not deviated significantly from it without significant volume, a trader can expect a return to the initial level.

In trending markets, the POC can also move in the direction of the trend, which confirms its strength.
Identify strong levels and CME currency futures liquidity with the help of Order Flow and use them to set entry/exit points. To do this, watch the delta and volume dynamics to confirm your ideas. Liquidity zones often become places for price corrections or strong impulse movements.
How to find reversal points using Order Flow
1. Volume Spike
A sudden increase in volume at a certain level often signals a change in market sentiment. This may be due to the activity of large players closing positions or changing the direction of trade.

To detect a Volume Spike, use Footprint Chart or other Order Flow tools to see if the Volume Spike is associated with aggressive buyers (Buy Market Orders) or sellers (Sell Market Orders).
For example, if the price is at a trend high and the volume spikes along with a large amount of selling (Bid), it may indicate a downward reversal.
To confirm a reversal after a surge in volume, look for a change in the delta, as a reversal zone indicator: if the delta goes from positive to negative (or vice versa), this is an additional signal of a reversal.
2. Imbalance
Imbalance is one more potential reversal zone indicator which occurs when there are significantly more aggressive buy (Buy Market) or sell (Sell Market) orders at a certain level. This can signal strong pressure on the price.
To find an imbalance, look for moments in the Footprint Chart when there is a large imbalance between buyers and sellers, for example, Buy 10,000 vs. Sell 2,000.
This is a clear sign that the level has attracted a lot of attention from one of the market participants.

If a large imbalance appears at a key level (for example, a support or resistance zone), it may indicate an attempted reversal. For example, the price approaches the support level and there is an imbalance with a large number of buyers (Buy Market Orders). This will be a signal for growth.
Also remember, there’s a huge connection between order flow and liquidity around NYSE trading halts, where temporary disruptions in trading can create significant imbalances in the market.
3. Low Volume Test
When the price approaches an important liquidity level, but the volume of trades remains low, it may indicate a lack of interest in continuing the current trend.
In the Volume Profile, pay attention to the Low Volume Nodes (LVN). If the price tests this level, but the volume remains low, it indicates the possibility of a reversal.

For example, if the price is approaching a resistance level and the volume of trades at this level is minimal, there is a high probability of a downward rebound.
Keep track of the delta and volumes, and if the price moves back in the opposite direction after the test, consider entering the position.
Use several factors to determine the reversal point more accurately and do reversal zone trading:
- A volume surge combined with iceberg orders.
- An imbalance of orders near an important liquidity level.
- Test levels with low volumes.
- Delta changes and price reaction after a Stop Run.
Improve your trading skills and discover how to identify CME bitcoin liquidity and reversal zones on CME indices with expert guidance at Bikotrading Academy. As a member, you'll receive:
- In-depth insights into the S&P 500 and Nasdaq 100.
- Access to clearly defined entry and exit levels for more precise trades.
- Learn directly from trading professionals in real-time on live sessions.
- Communicate with fellow traders in a dedicated group chat for market updates and shared strategies.
- Learn different approaches to predict the most significant price reversal zones and liquidity zones.
- Get personalized strategy sessions with experienced traders to sharpen your skills.
Simply fill out the form, and our manager will provide all the details to get you started.
Conclusion
Based on Order Flow analysis, you can accurately identify liquidity zones and reversal points on CME indices. If you master liquidity zone trading, it will allow you to pinpoint key levels where large volumes of buy or sell orders concentrate. If you master how to identify common factors in prices, order flows, and liquidity, and define the most profitable CME trading hours, you’ll get a huge advantage on the market. Use various indicators and tools to identify liquidity zones and predict price reversal zones, improve your strategy, and start CME trading with Bikotrading Academy.


