Best Order Flow indicators for CME trading
By Yuriy Bishko January 30, 2025
10+ years in crypto trading and investing, in asset management since 2019, co-founder of BikoTrading.
Developed personal highly profitable swing and scalping strategies for the crypto market.
KEY ISSUES:
Order Flow is one of the key tools for understanding market changes and actions of different market participants. WIth this approach you can analyze the activity of buyers and sellers in real time. For trading on CME, the use of Order Flow is especially relevant due to the high liquidity and trading volumes. In this article, we will analyze the main Order Flow indicators and help you choose the best one.
What is Order Flow and why is it important?
Order Flow analyzes data coming from the Order Book, which includes information about limit and market orders. It allows traders to:
- Determine support and resistance levels.
- Identify the moments when major players enter the market.
- Analyze the balance between buyers and sellers.
- Estimate where trends may stop or continue.
Trading on CME includes instruments such as futures on crypto coins, indices, oil, gold, or agricultural commodities, and understanding the flow of orders allows you to quickly adapt to changes in the market.
Main Order Flow trading indicators
There are many indicators that help analyze order flow. Let us consider the most popular ones.
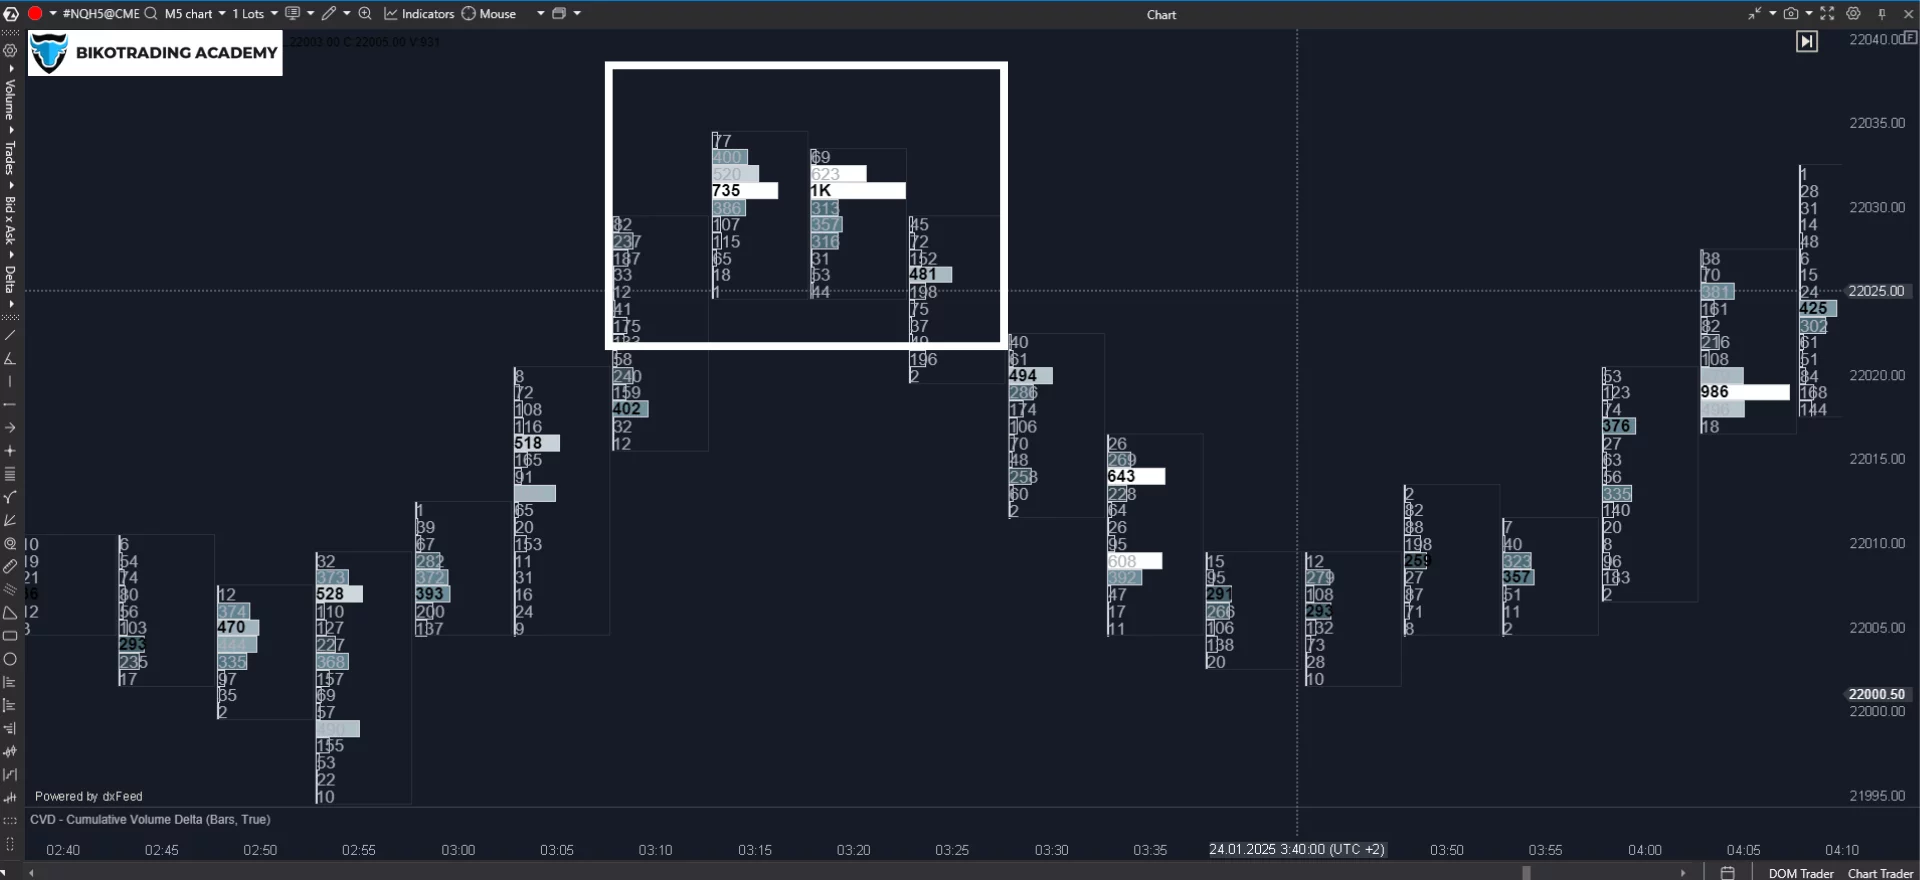
A Footprint Chart is a type of chart that displays the volume of transactions at different price levels. It allows traders to see how many contracts have been bought or sold at a particular price. Main functions:
- Shows the number of buy and sell orders at each price level.
- Serves as an order flow imbalance indicator as it reveals imbalance between buyers and sellers.
- Allows you to analyze accumulation (volume accumulation) and distribution zones.
- It helps to identify key levels where the market can turn around.
- Identifies areas where large players are present.
Footprint Chart is suitable for short-term trading, including scalping, as it provides detailed information about market changes in real time.
Delta
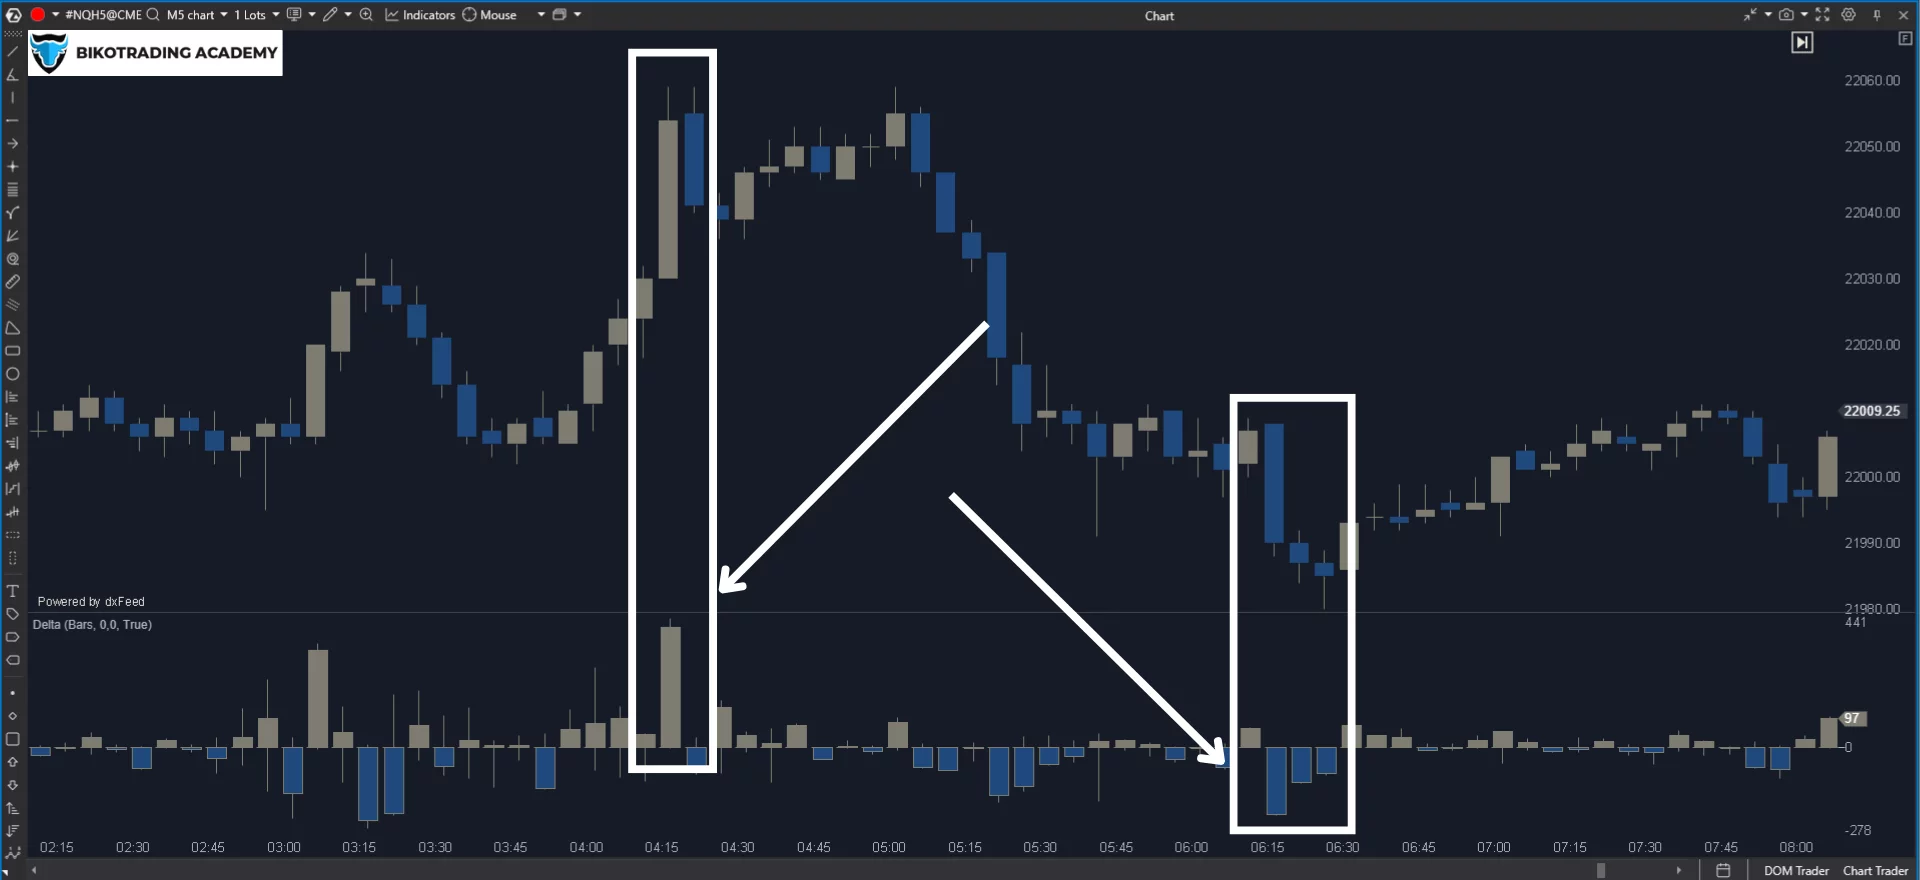
Delta is an order flow analysis indicator that shows the difference between the volume of market purchases (Bid) and sales (Ask). It is a kind of bid ask order flow indicator and allows you to assess which side of the market (buyers or sellers) dominates.
- A positive delta indicates a buyer's advantage.
- A negative delta indicates the dominance of sellers.
- It also identifies entry points of major players.
- It helps to recognize potential trend reversals.
Delta works well to confirm the strength of a trend or identify areas of possible reversal.
Cumulative Delta
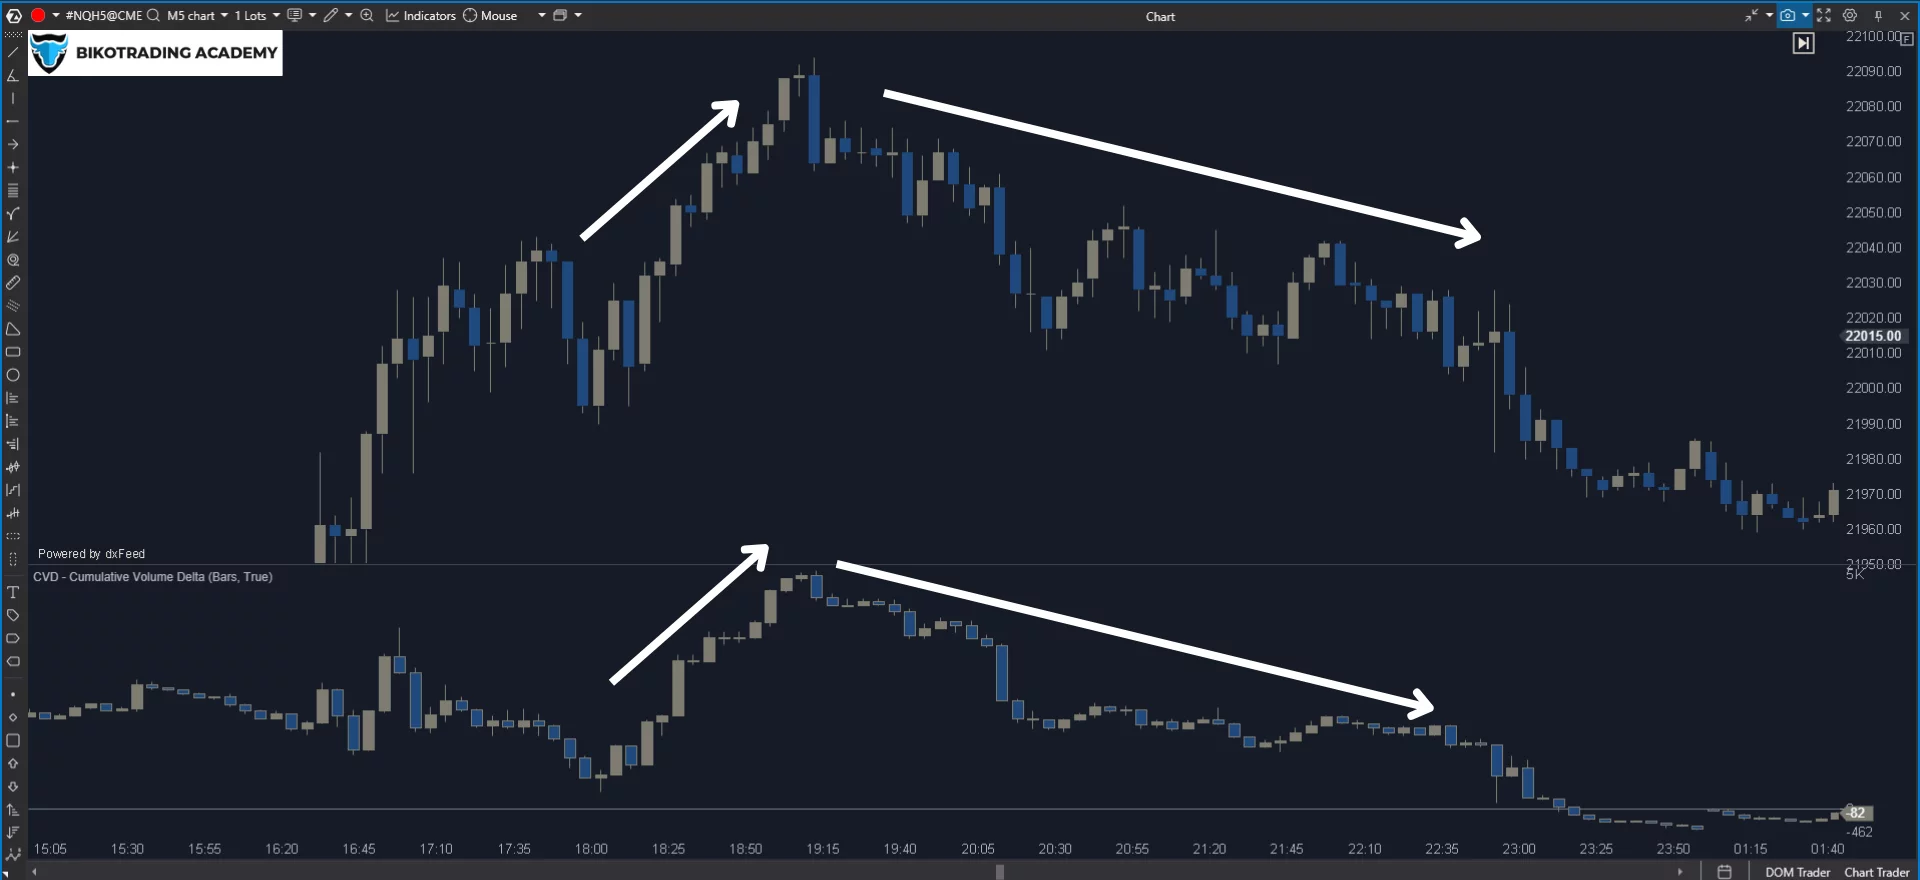
Cumulative Delta is an indicator that tracks the accumulated delta over a certain period of time. It provides a more complete picture of the balance of buyers and sellers. It reflects the general market trend and allows you to identify discrepancies between price and volume (divergence).
Key advantages:
- Identifies moments when large players begin to accumulate or distribute positions.
- It helps to analyze the strength of a trend.
Cumulative Delta is useful for medium-term analysis and confirmation of market trends.
Volume Profile
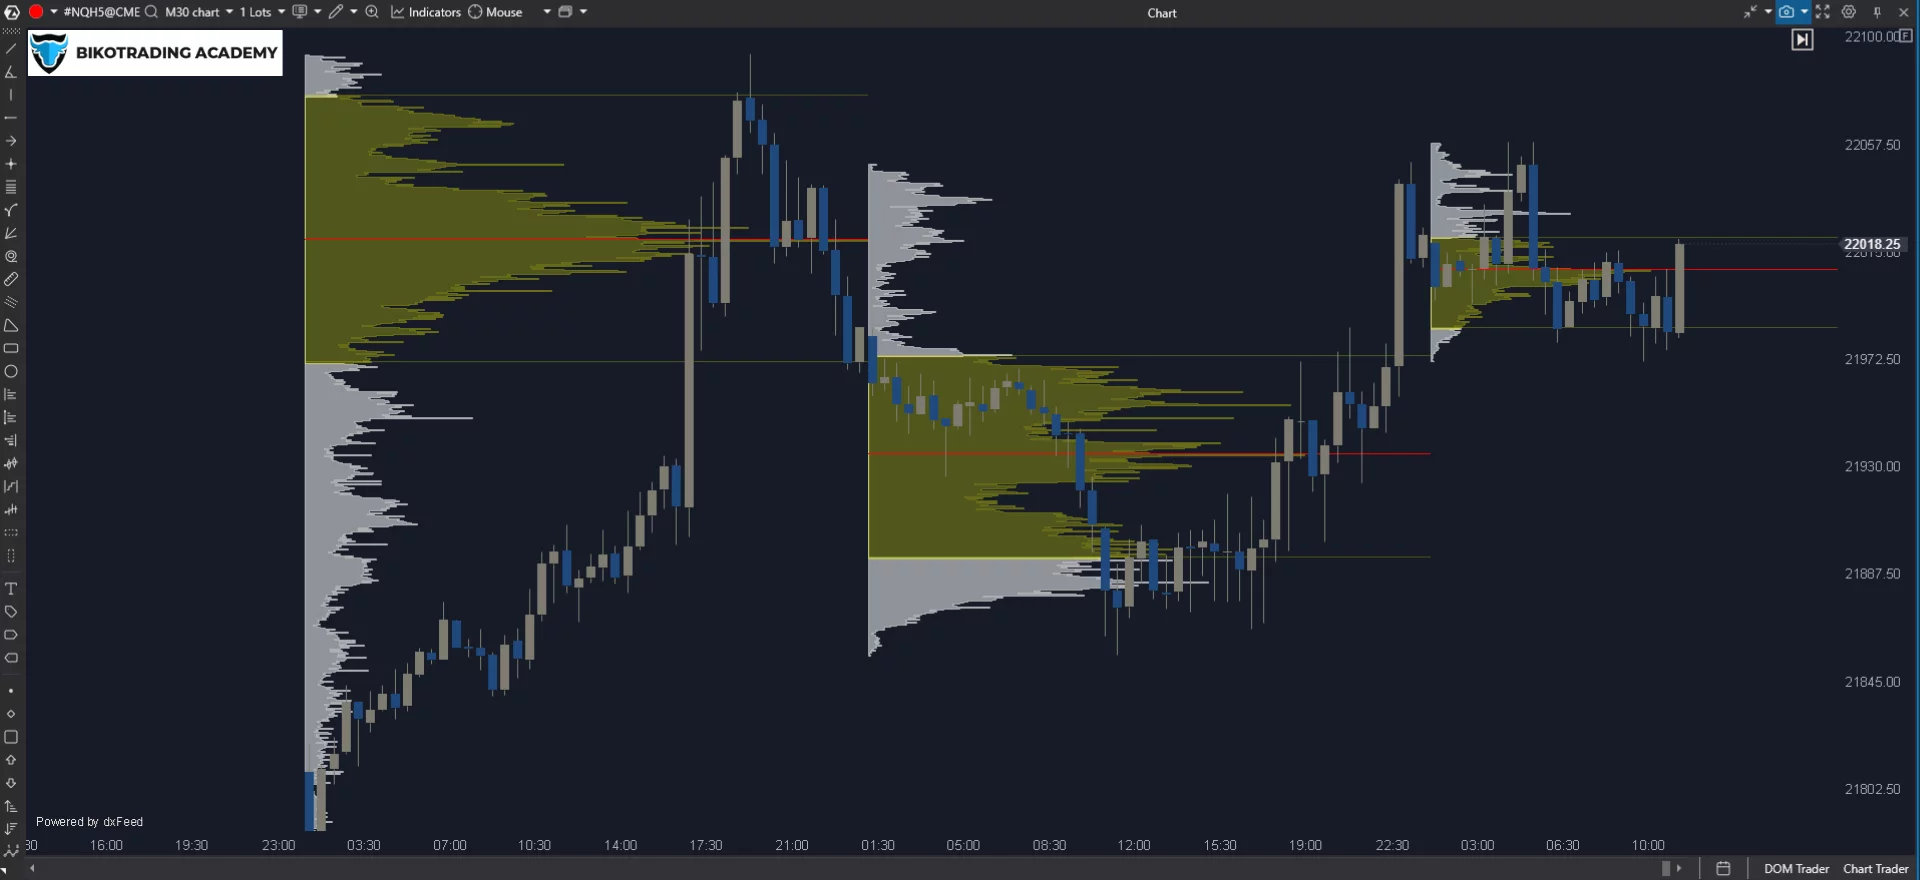
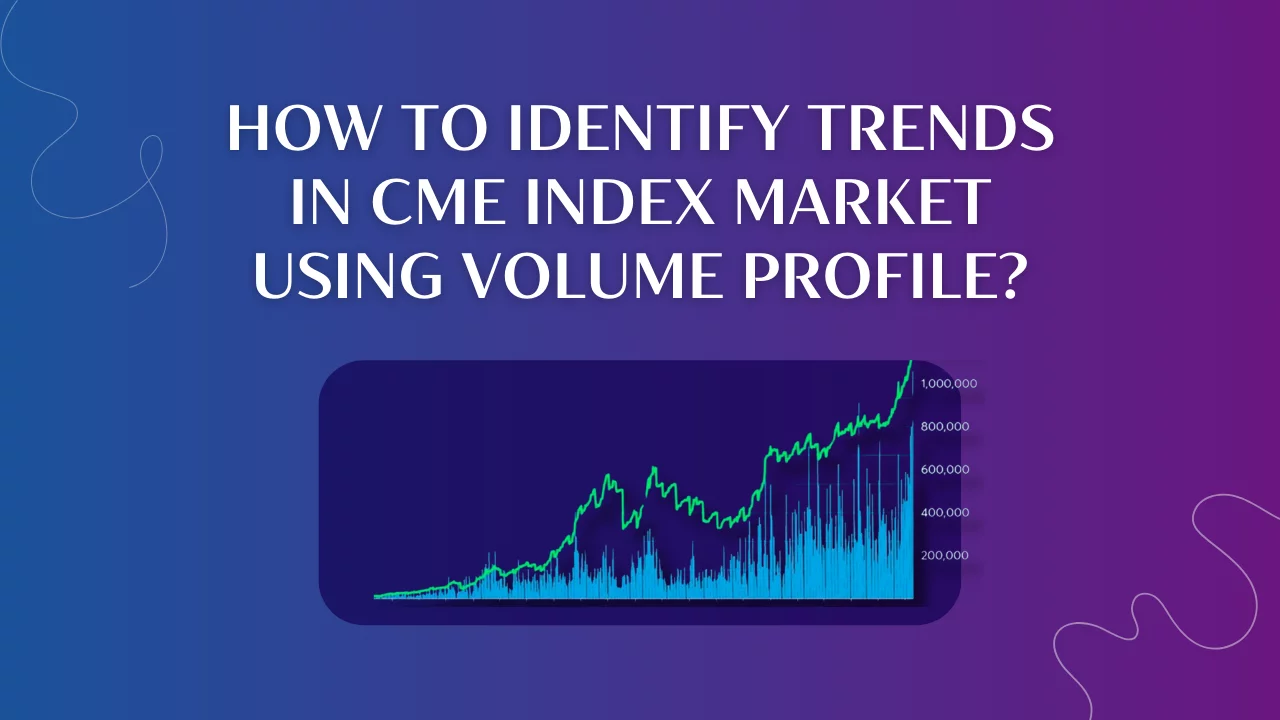
Volume Profile is one of the order flow analysis indicators that displays the distribution of trading volumes at different price levels in the form of a horizontal bar chart. The market order flow volume indicator allows you to see where the market has the most liquidity.
Key elements:
- POC (Point of Control) – the level with the highest transaction volume.
- Value Area (VA) – the area where 70% of the trading volume took place.
- High/Low Volume Nodes – levels with high or low activity.
Order Flow Volume Profile indicator is used to analyze both short- and long-term trends. It is especially useful for understanding the market structure and finding key levels. This indicator shows support and resistance zones, and helps to identify zones with a high probability of reversal.
Order Book Heatmap
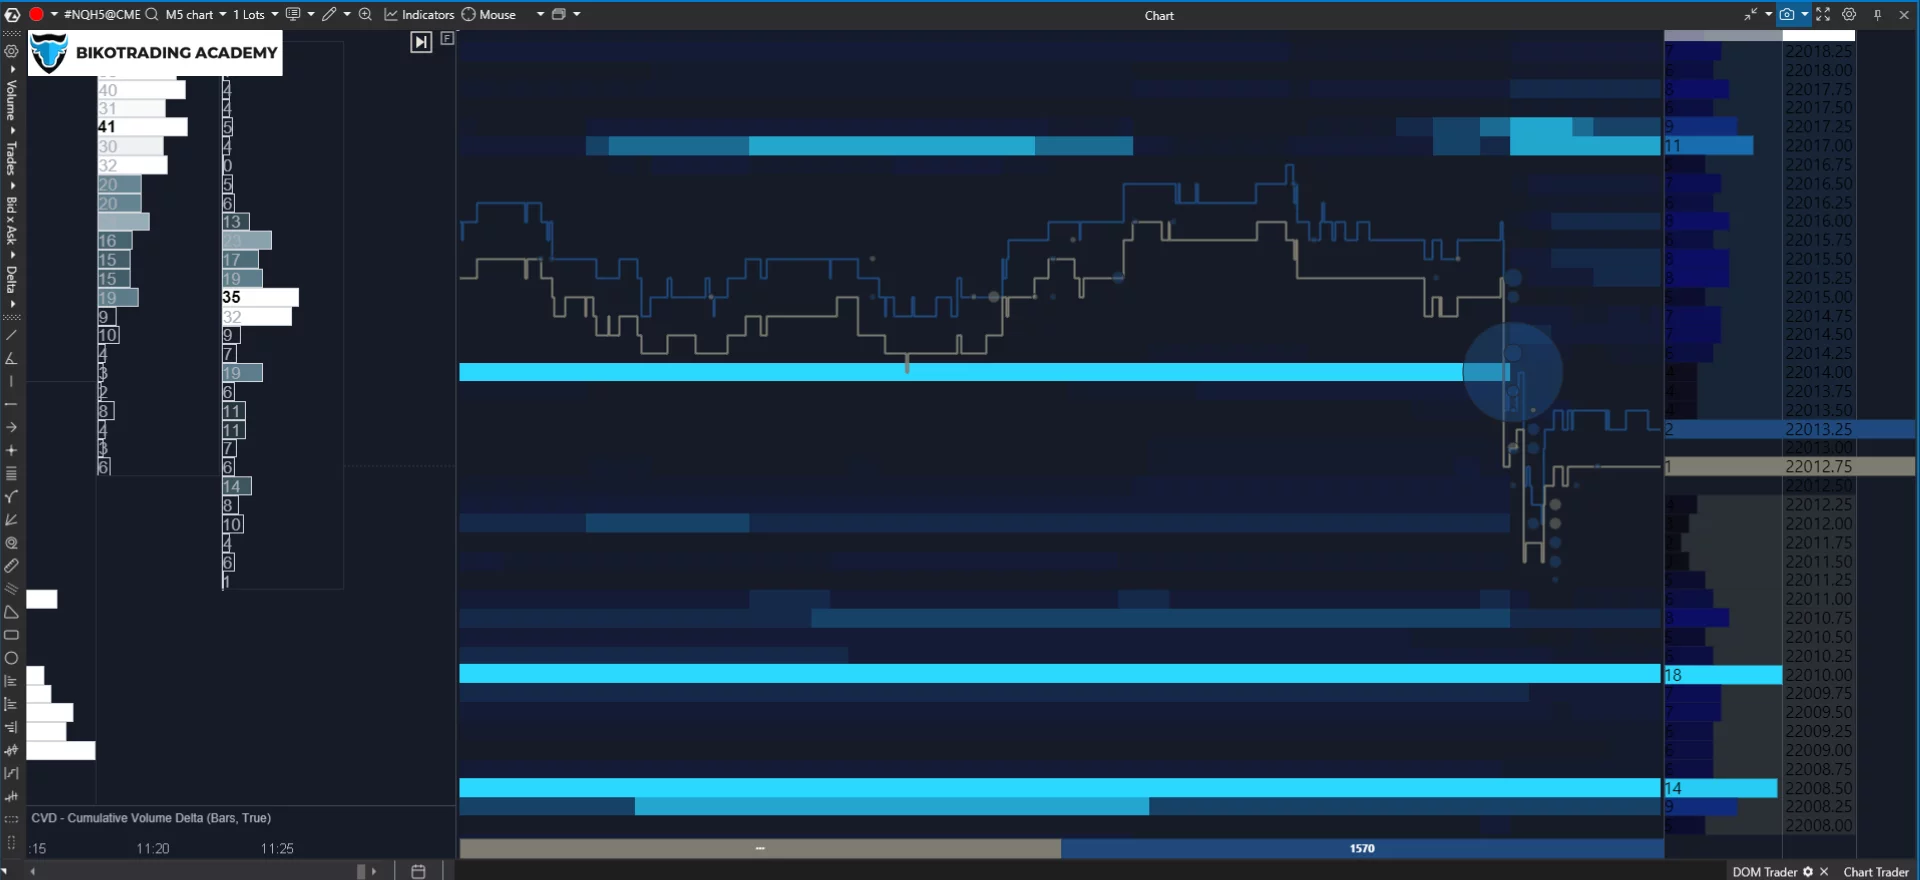
Order Book Heatmap is a visualization of the Order Book that shows the activity of limit orders in the form of a heat map. Darker colors represent areas with the highest concentration of orders.
Key advantages:
- Shows where large market participants place their orders.
- Allows traders to see possible price barriers.
- Identifies areas where price may slow down or reverse.
- Helps to predict price movements based on the activity of limit orders.
The Order Book Heatmap is suitable for scalpers and intraday traders who want to understand short-term market dynamics.
Market Profile
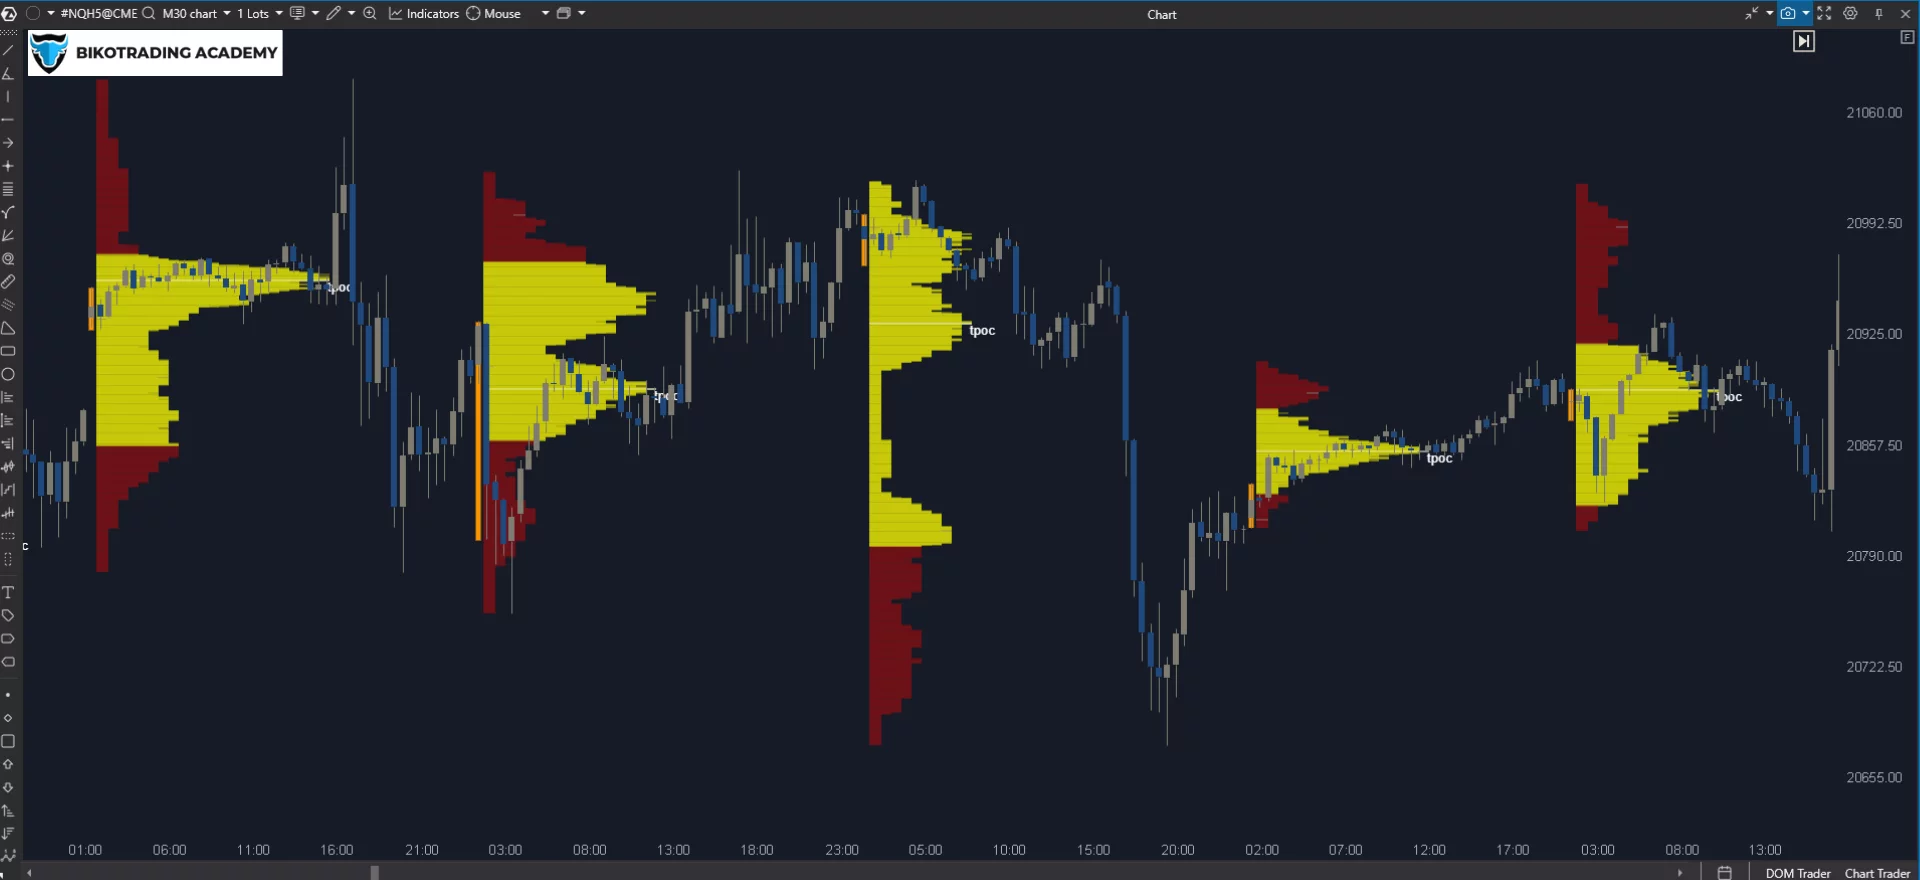
Market Profile is an indicator that displays price activity in the form of a time distribution. It allows you to see how long the market has been at certain levels.
Key elements:
Initial Balance (IB) – the first hours of trading that set the tone for the day.
Value Area – the area where the price was located most of the time.
High/Low – extreme levels of the day.
Market Profile is suitable for intraday traders and those who work with futures on CME. It allows you to build strategies based on time allocation, reveals the market structure, and helps to understand whether the market is trending or sideways.
Join our private Bikotrading CME trader club and improve your trading career! Here's what you'll gain:
- Receive in-depth analysis of key indices like the S&P 500 and Nasdaq 100 to stay ahead of market trends and futures CME trading.
- Get clearly defined trade zones to help you identify entry and exit points for trading on CME with confidence.
- Trade alongside professional traders during live sessions on the best CME trading hours and see their strategies in action.
- Join a group chat with fellow traders for valuable insights, updates, and real-time market support, and change the CME trading challenge into profitable trades.
- Schedule individual strategy sessions with experienced traders to improve your trading approach and take the most advantage of every CME trade.
Fill out the form and get exclusive templates developed by the Bikotrading team. Our manager will reach out to provide all the details you need to get started.
How to choose the best indicator for CME trading?
The choice of indicator depends on your trading strategy, trading style, and personal preferences. Here are some recommendations:
- For scalpers: Choose indicators with high detail such as Footprint Chart or Trades Tape. They provide instant information about market activity.
- For intraday traders: Volume Profile and Cumulative Delta will help you identify key levels and understand the overall market picture.
- For medium-term traders: Use Volume Profile and Order Book Heatmap to identify long-term support and resistance zones.
- For beginners: Start with simple indicators such as Delta or Volume Profile on the CME trading simulation.
Conclusion
Each of the indicators discussed above has its own strengths and is suitable for different trading styles. In indicator trading order flow offers many good options to implement in your trading strategy. Footprint Chart and Delta work well for short-term analysis. Use Volume Profile and Market Profile for medium-term trading, and Order Book Heatmap for scalping. The choice of indicator depends on your goals, experience, and trading style. The choice of indicator depends on your goals, experience, and trading style. Futures trading CME offers a wide range of possibilities, and the correct use of Order Flow can be the key to successful trading. If you are just starting out, try several indicators on the CME trading platform and find the one that works best for you.

