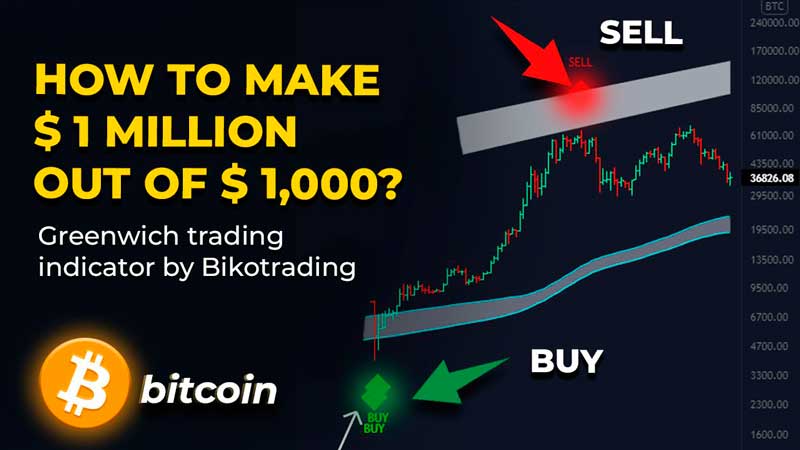
Instructions for the Greenwich trading system
By Yaroslav Krasko Updated on August 30, 2024
BikoTrading Academy
KEY ISSUES:
What do the indicator symbols mean?
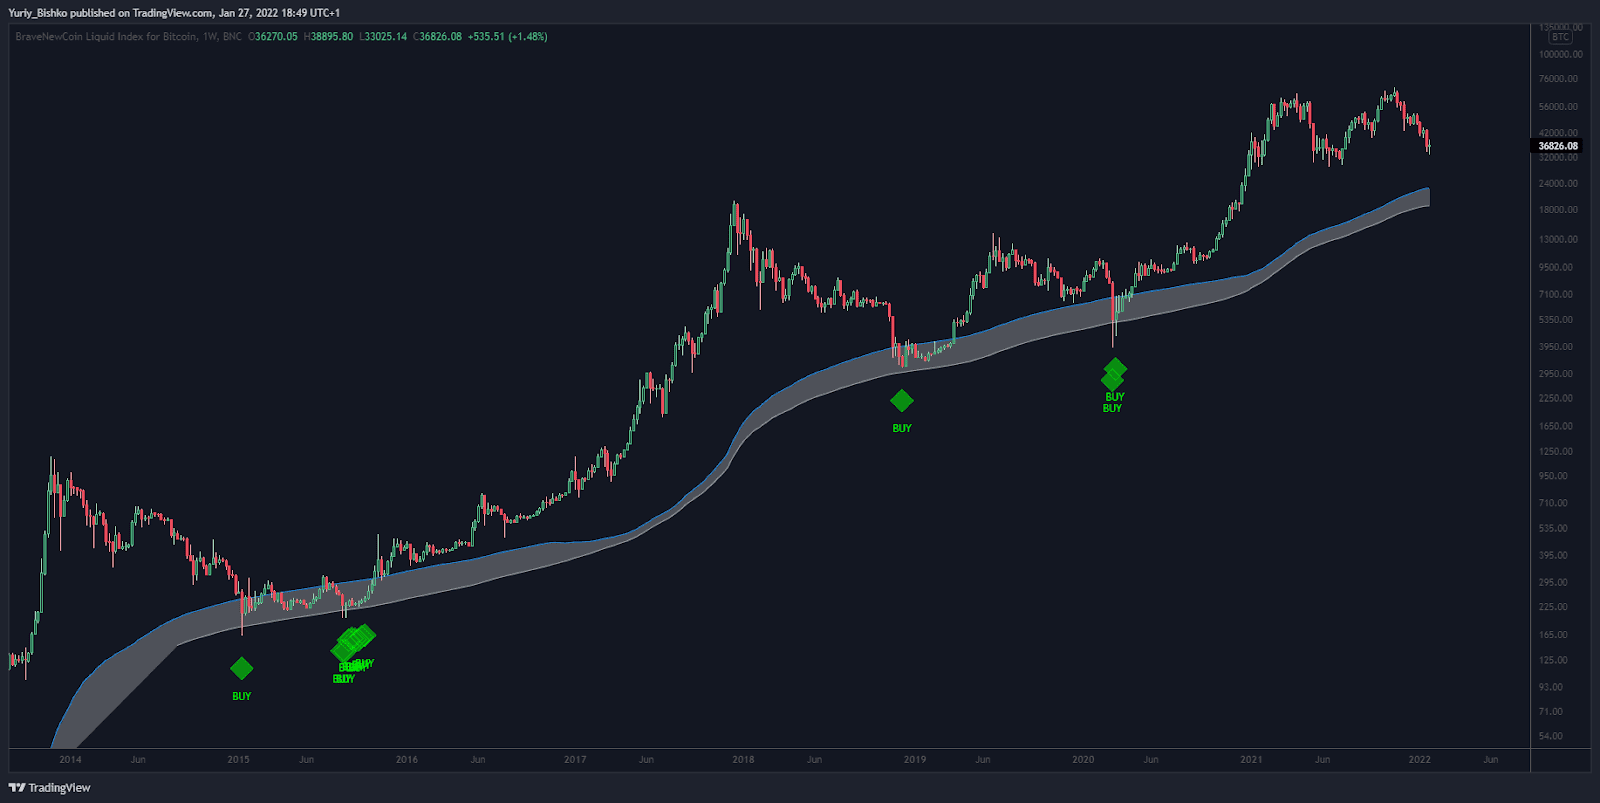
- green diamonds, the symbol indicates that the price has reached the bottom of the market and this is the best time to buy bitcoin on a spot account.
- red diamonds signal the end of the trend, or the beginning of a strong correction.
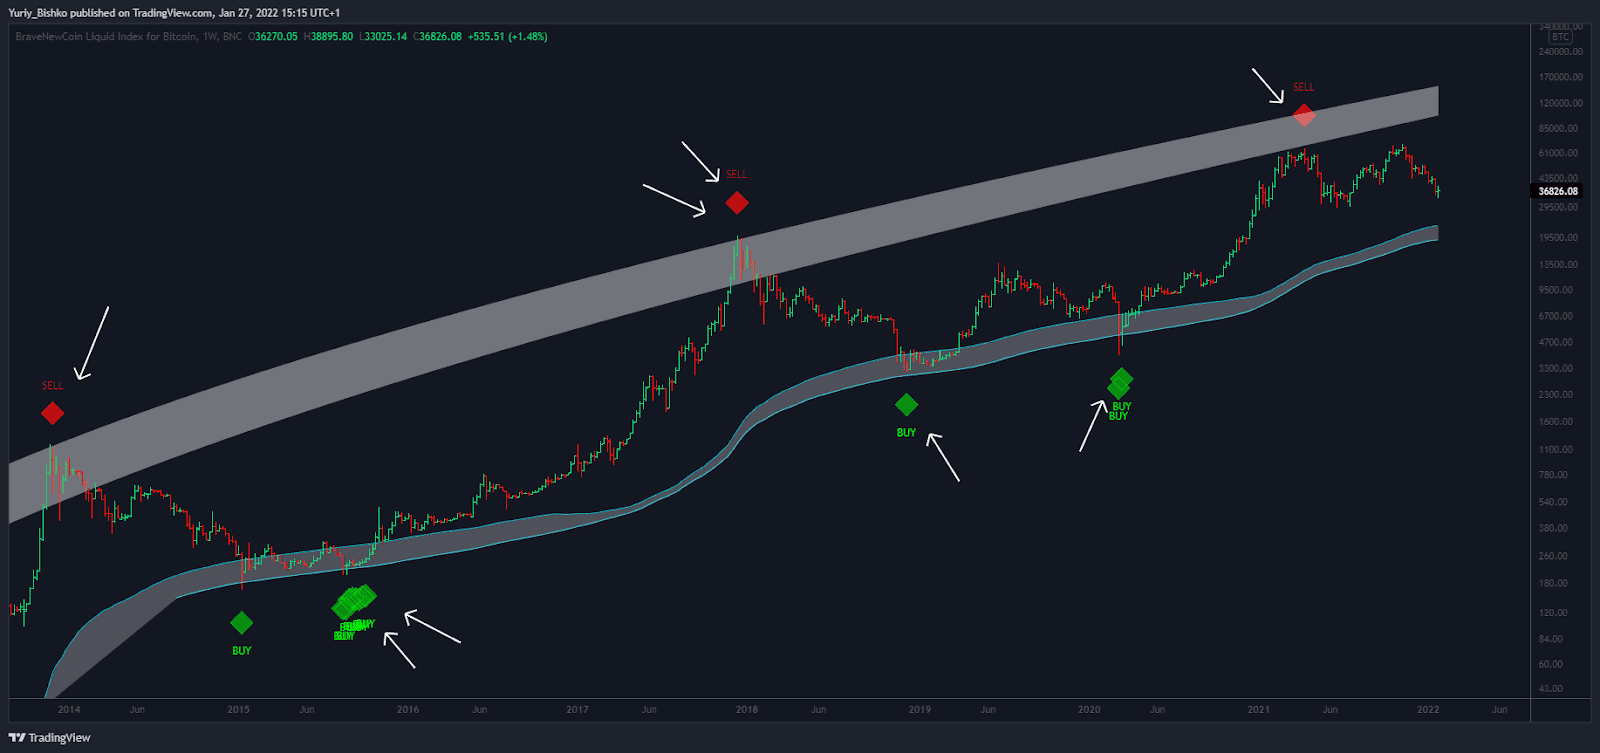
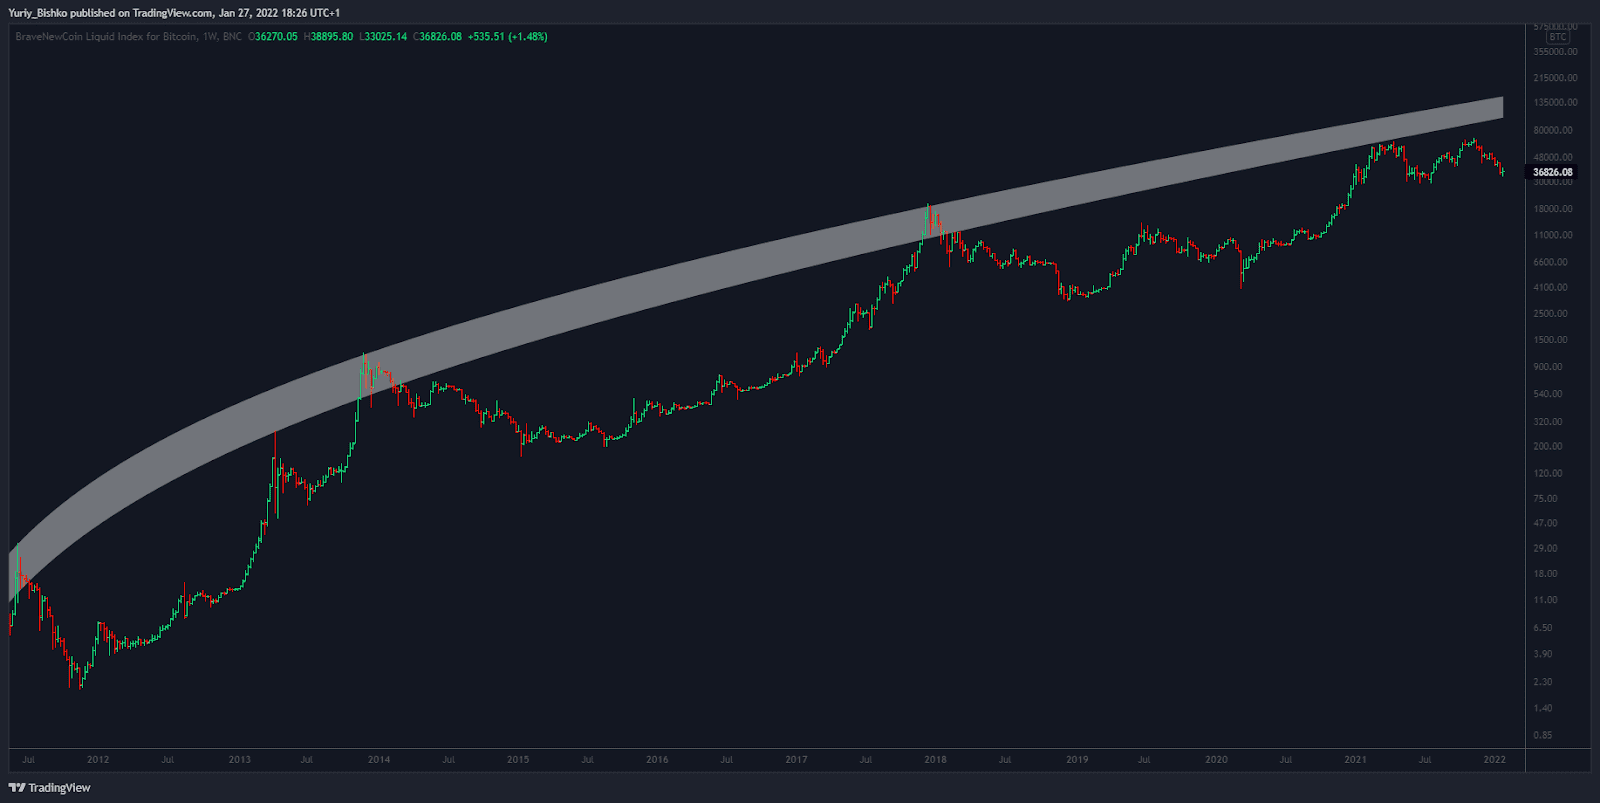
- the white area at the top roughly indicates the maximum of the market, and signals that you need to prepare for the end of the bullish market (the indicator has a purely informational function)
- the white area at the bottom indicates the market minimum and signals that now is the best time to buy altcoins and bitcoin.
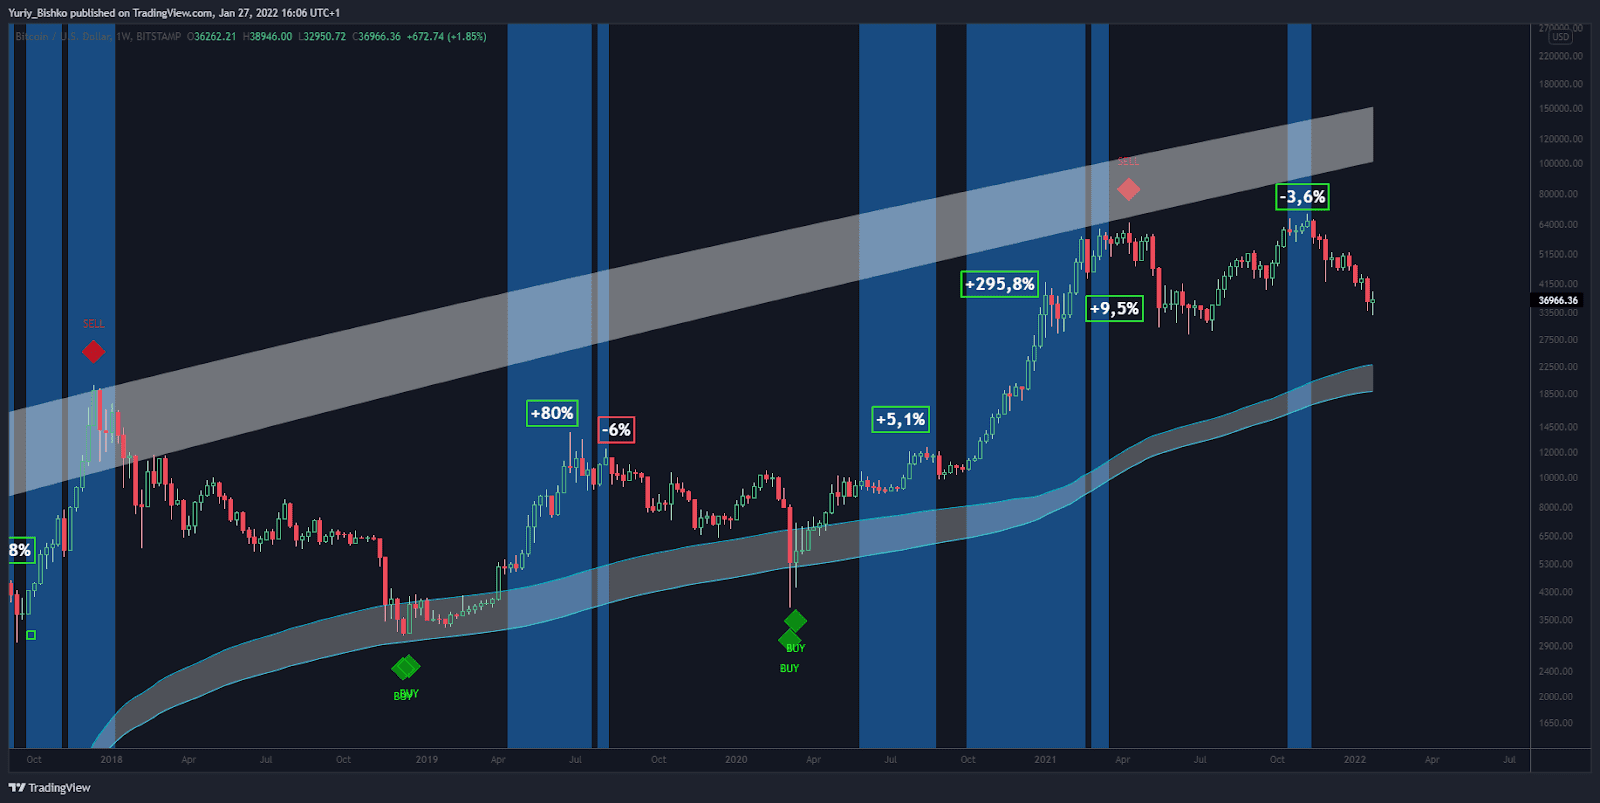
- blue area (opening a futures position with leverage)
How to use the Greenwich trading system?
There are two ways to trade on the Greenwich system.
In order to better understand the work of the trading system, we want to show you this chart. Bitcoin cyclicity chart. Bitcoin moves in cycles. The cycle lasts about 4 years, of which 1.5 years are in decline and 2.5 years in the growth phase.
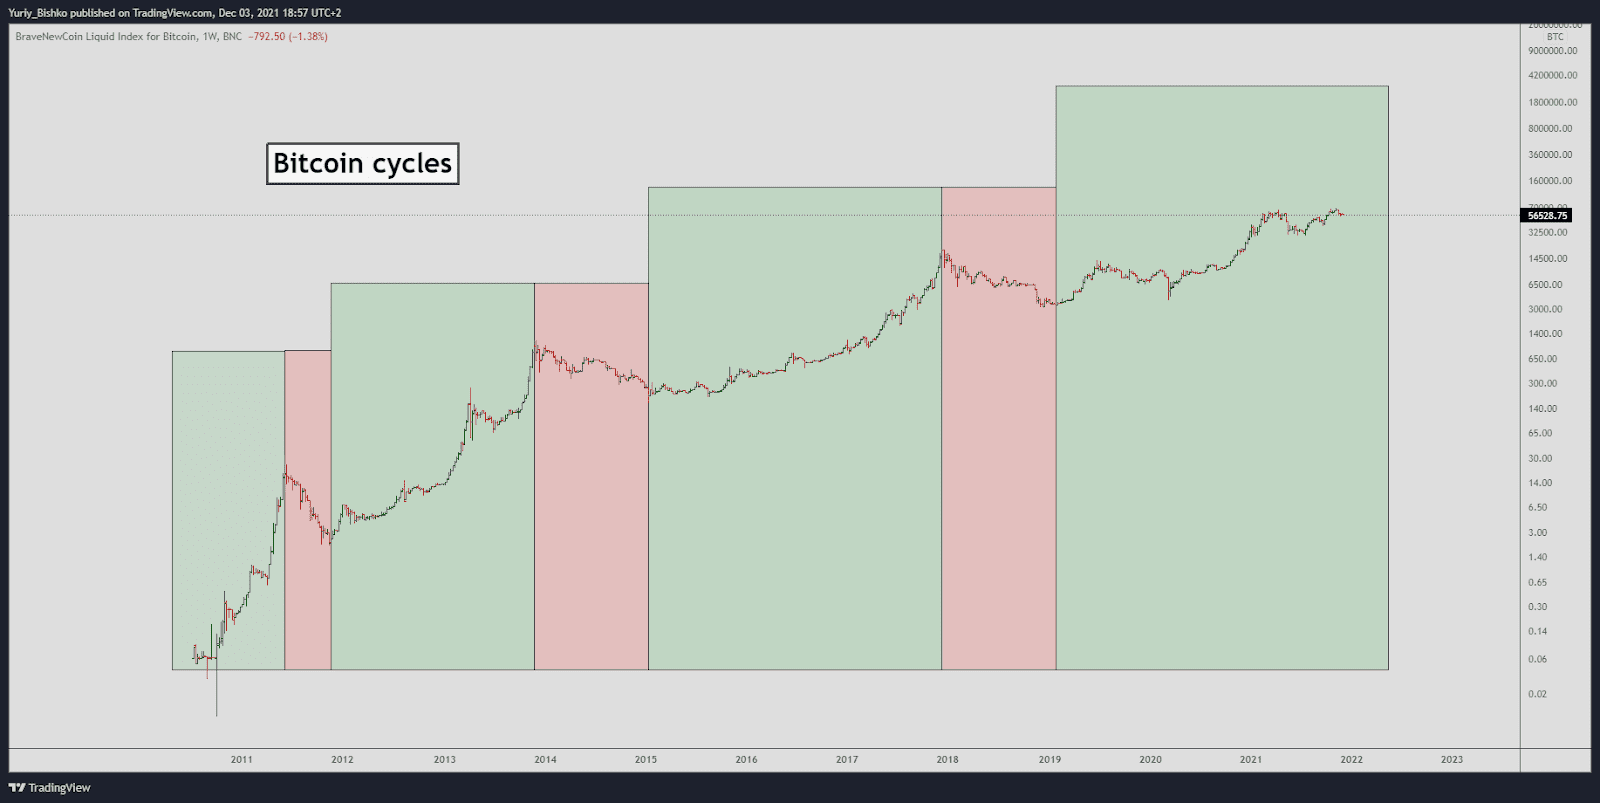
The essence of the system that brings superprofits is that we increase the number of bitcoins, while we also earn on the growth of bitcoin itself.
The Greenwich trading system consists of 2 strategies and a large amount of supporting data:
- the aim of the first strategy is to identify the bottom and maximum of the cycle.
- he aim of the second strategy is to increase the number of bitcoins.
As a result, we get double the profit.
The first and most profitable way to use the system, if you managed to buy at the bottom of the market (with the appearance of green diamonds)
Let's look at a real example, and show how you could increase your capital 136 times in the last 2 years, and how to do it now. As an example, let's take 1 thousand dollars.
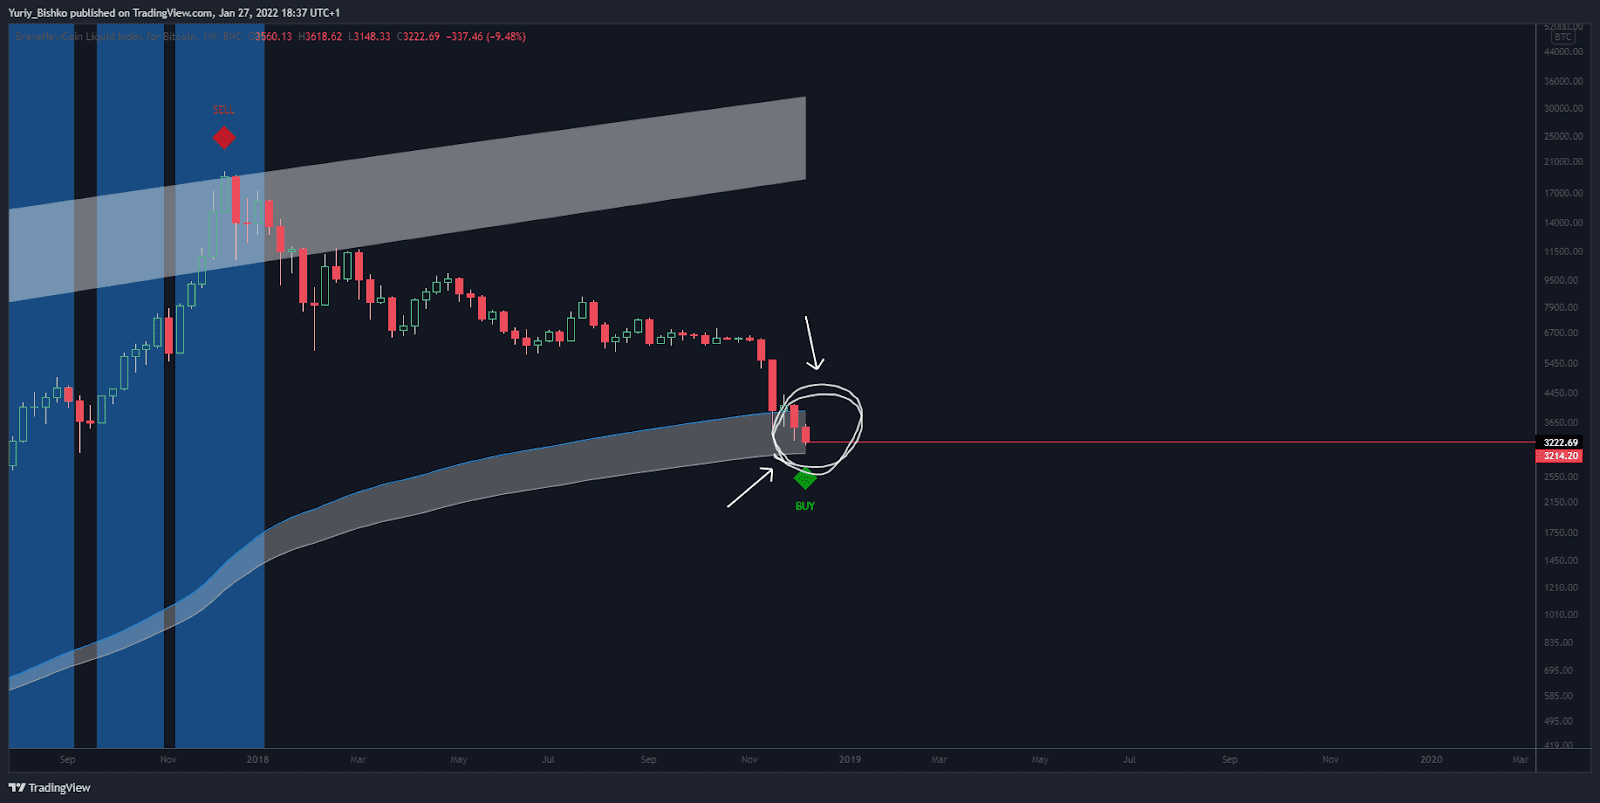
Signal (green diamond)
After the weekly candle is closed (UTC: 00:00 weekly candle closing time) and the signal remains on the chart, you have to buy bitcoin on your spot account.
We buy bitcoins in the amount of $1 000
Price - $ 3200
1 thousand dollars = 0.31btc
We have bought bitcoin on our spot account, and we are waiting for signals of a medium-term strategy by which we will increase our number of bitcoins.
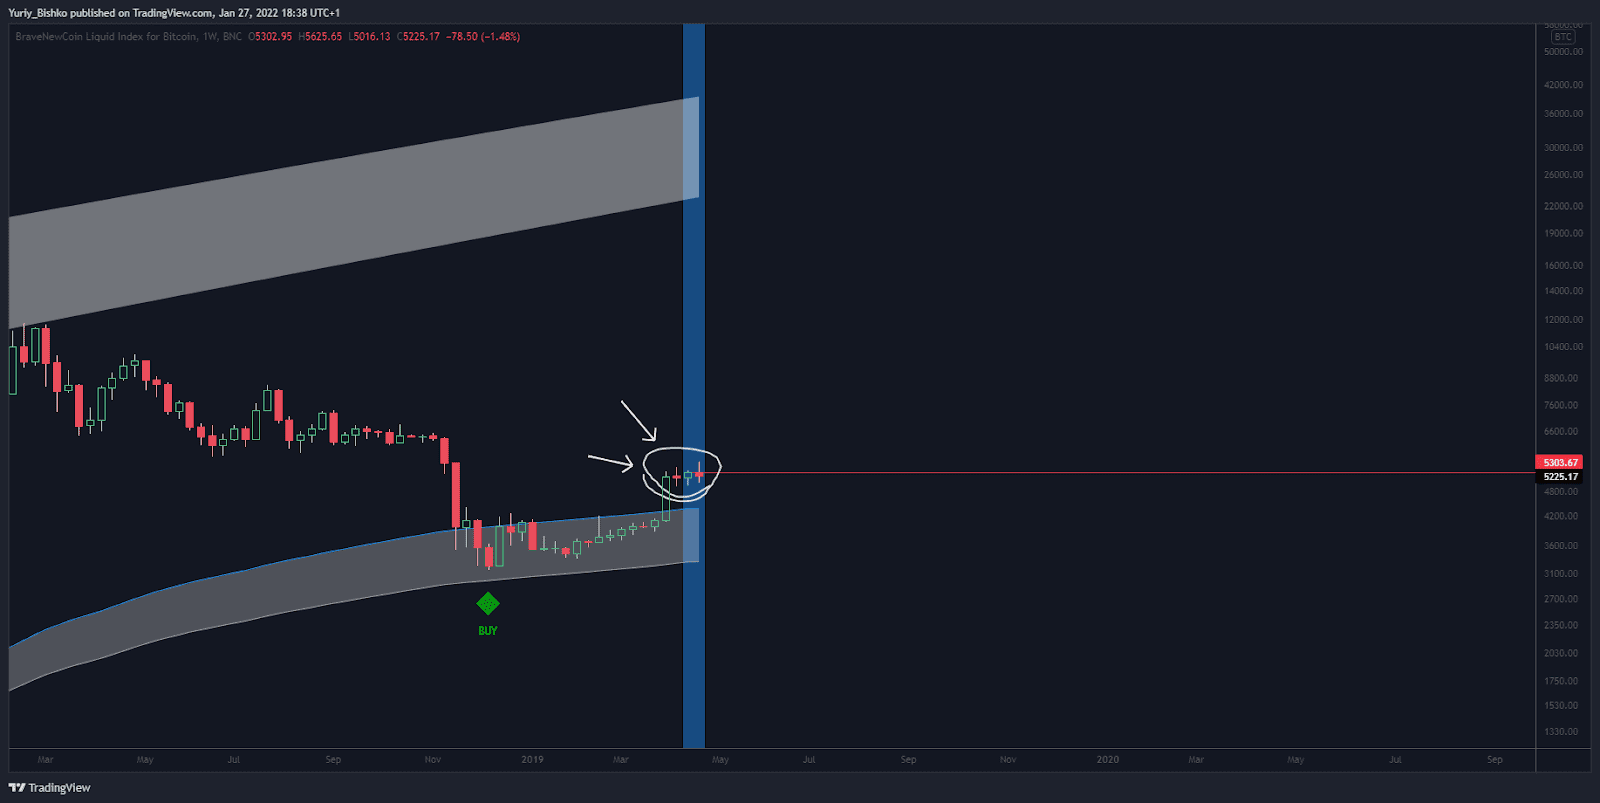
A blue area appears on the chart, signaling to open a leverage position.
Once the weekly candle has closed (UTC: 00:00 weekly candle closing time) and the blue area remains on the chart, you should open the leverage position. We will send video and text instructions on how to open a futures position with leverage on the Binance coin-m account.
We open a futures position on the coin-m account with 1x leverage
Price - $ 5300
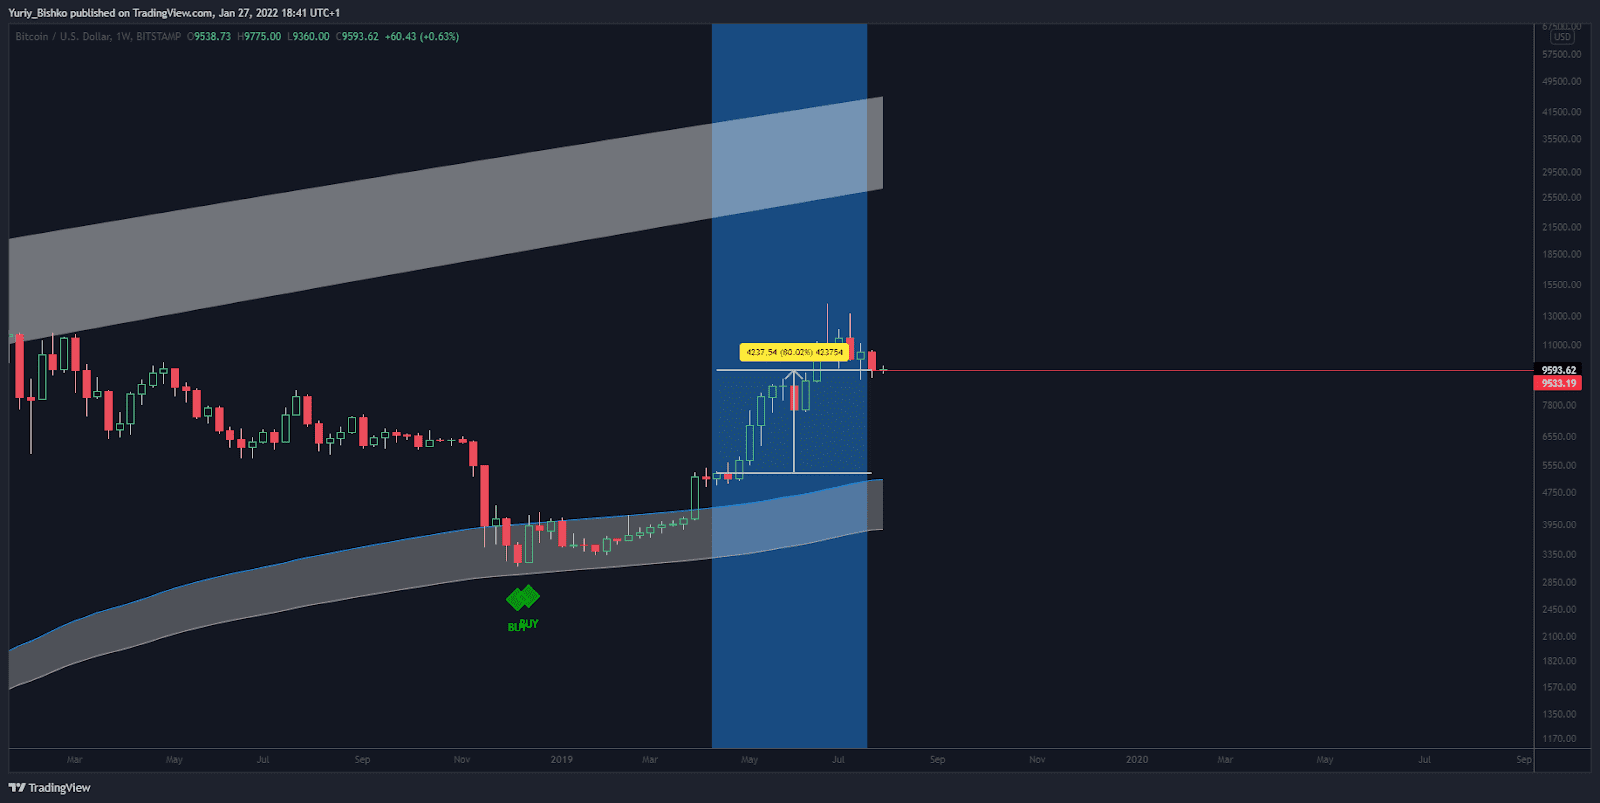
We held the position for 14 weeks.
At the close of the weekly candle, the signal disappeared and we closed our futures position.
Our profit was + 80%.
We had 0.31 btc, add our profit + 80% = 0.56 btc
As a result, we have more btc and the price of bitcoin has increased from 3.2 thousand dollars to 9.5 thousand dollars.
Now our balance is = 0.56 btc x $ 9,500 = $ 5,300
Our $ 1,000 turned into $ 5,300
We are waiting for a new signal
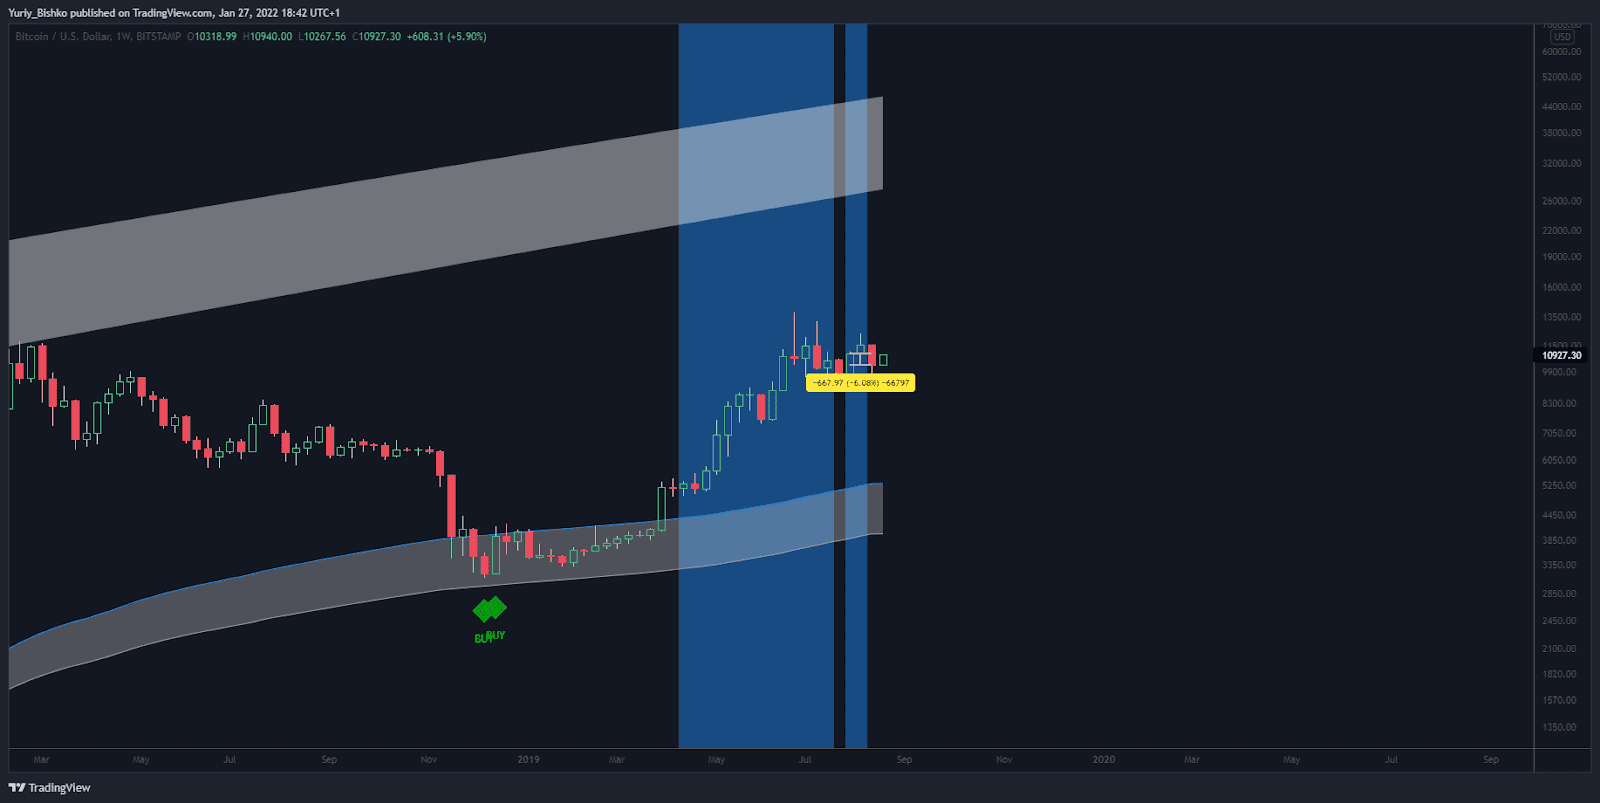
The next trade, we open and close on the same principle.
Our loss was - 5.97%
Our balance: 0.56 btc - 5.97% = 0.53 btc
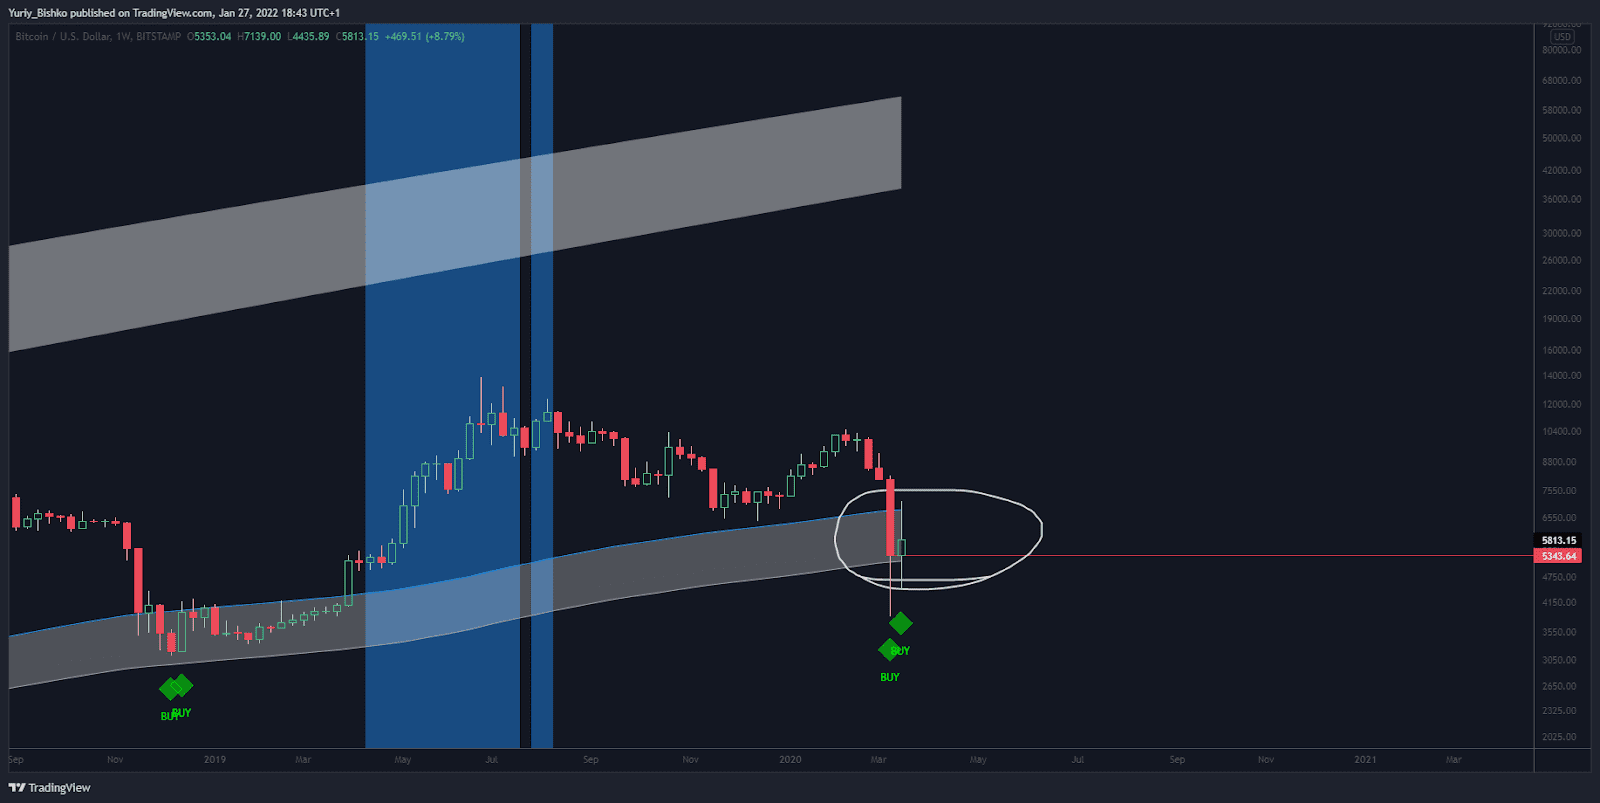
Then the signal (green diamonds) reappeared on the chart. Another good option if you have not been able to open spot positions.
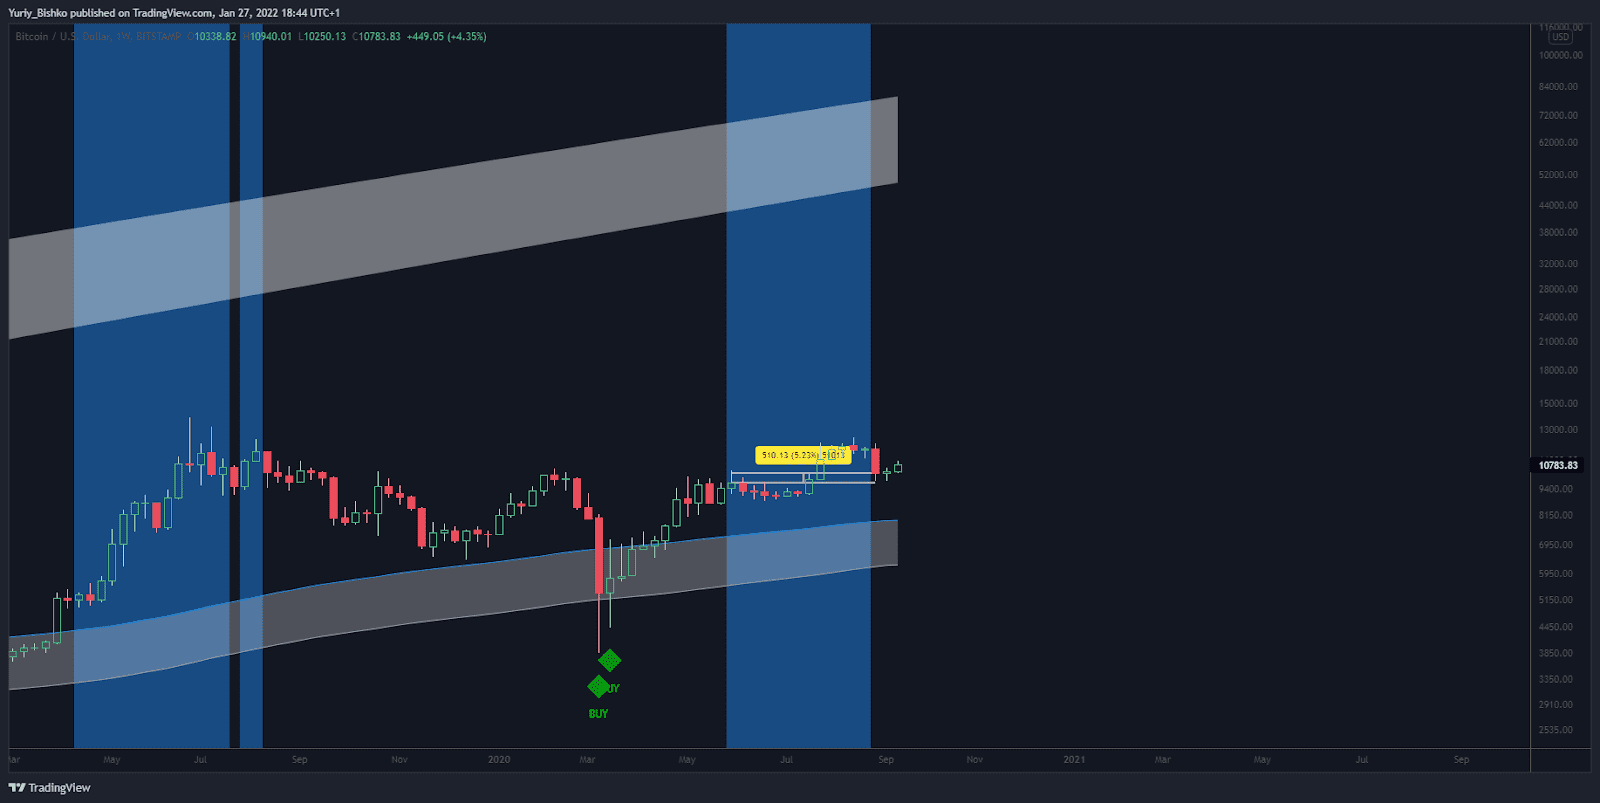
The next trade
Our profit was + 5.19%
Our balance: 0.53 btc + 5.19% = 0.56 btc
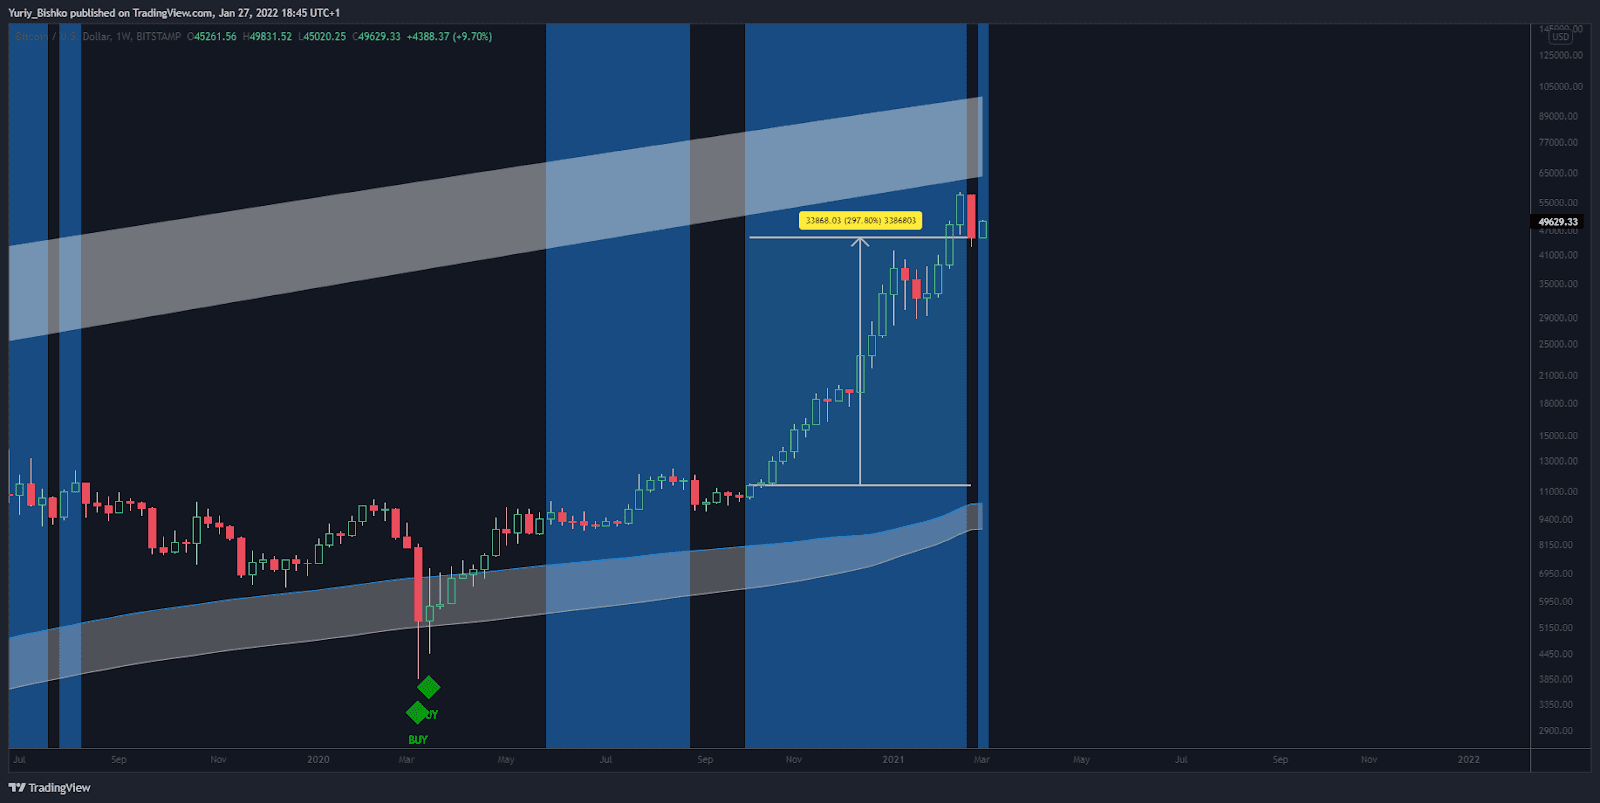
The next trade
Our profit was + 297%
Our balance: 0.56 btc + 297% = 2.22 btc
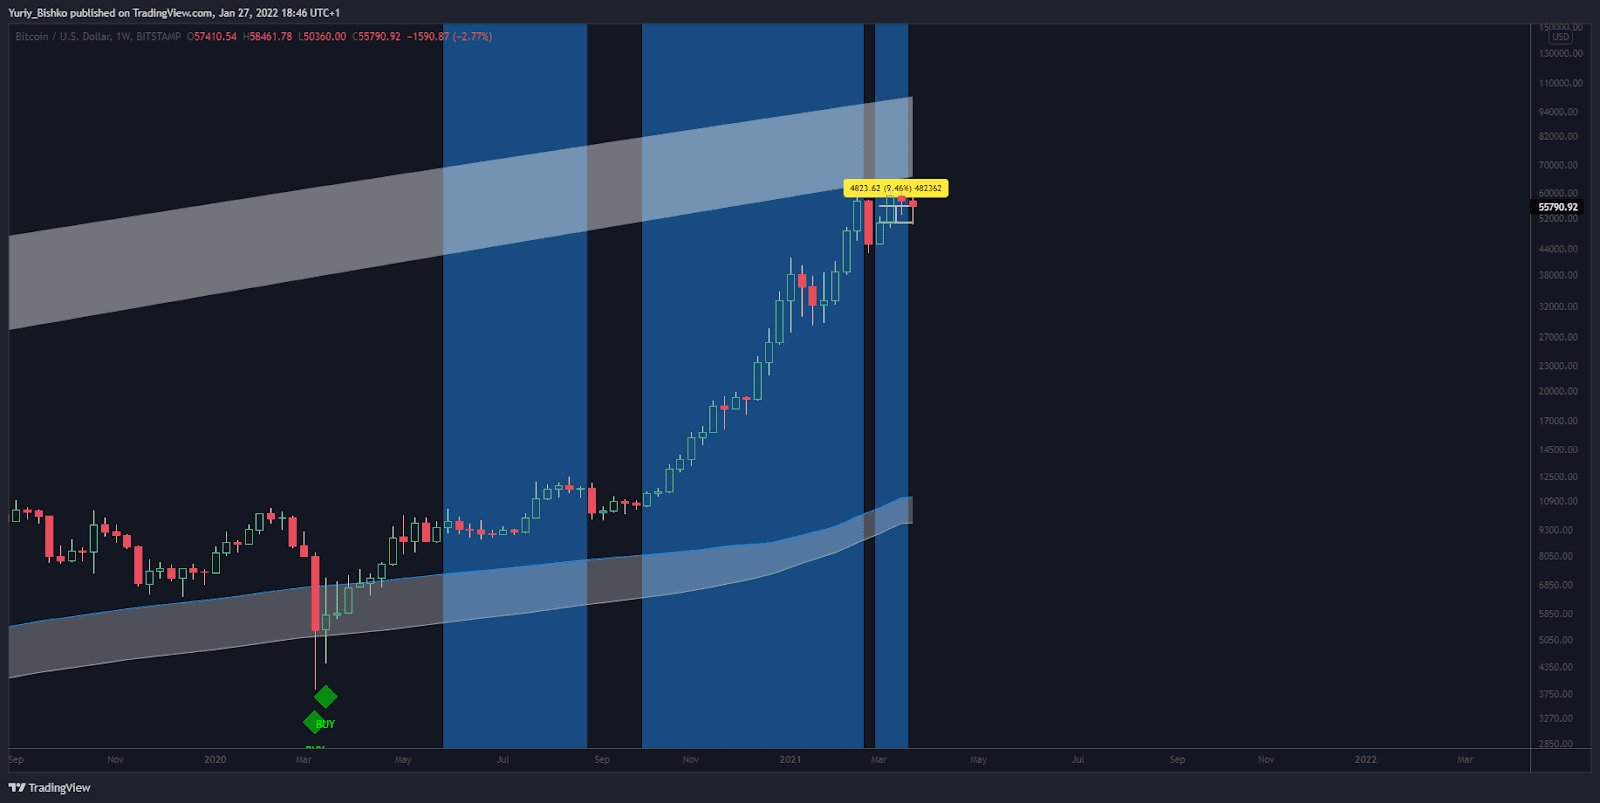
The next trade
Our profit was + 9.5%
Our balance: 2.22 btc + 9.5% = 2.43 btc
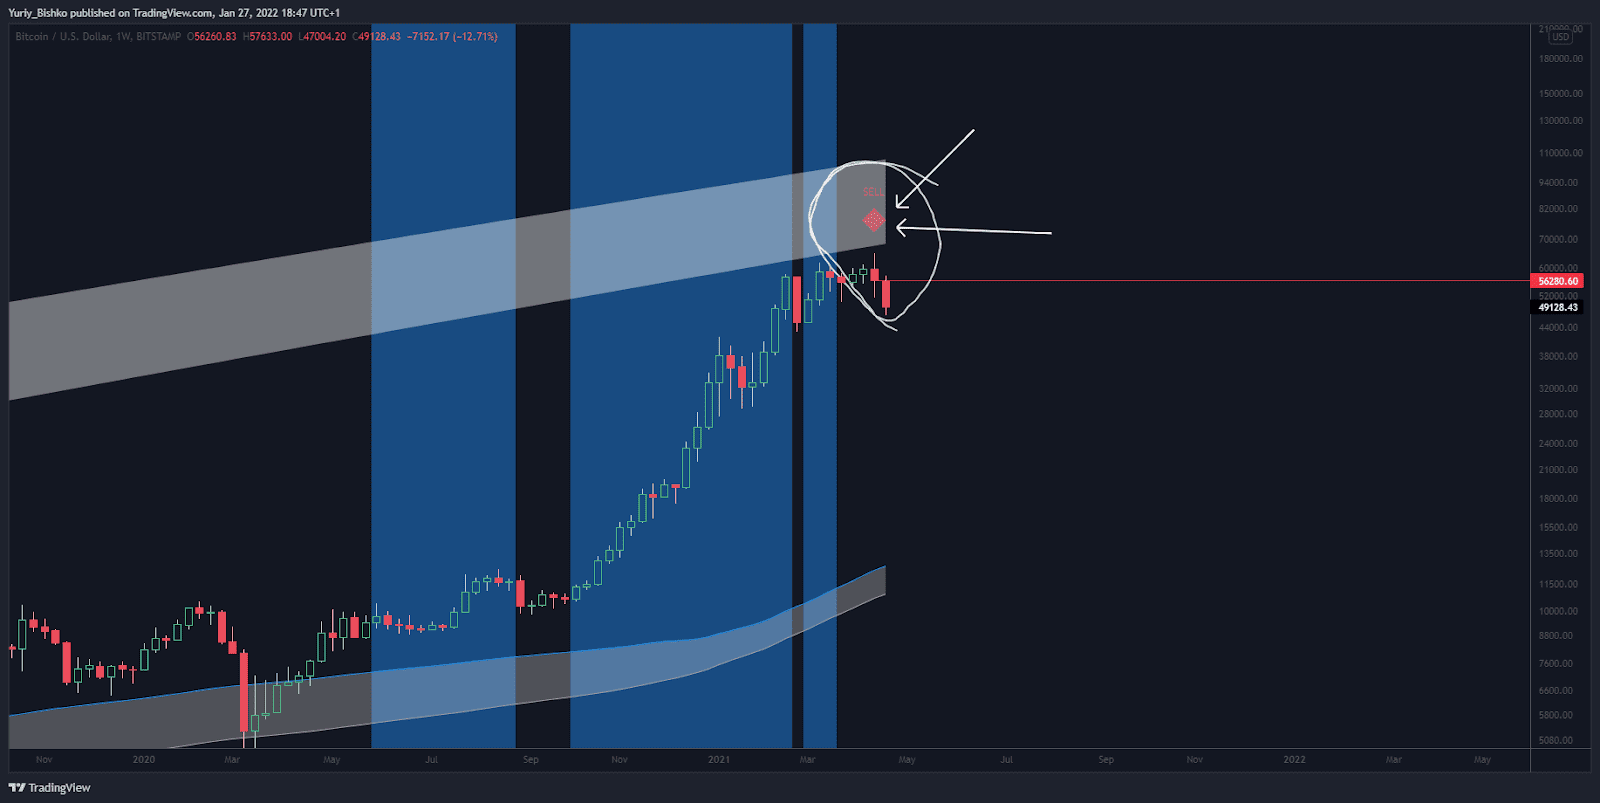
A red diamond appeared on the chart at $ 56,000, signaling to fix the positions and sell bitcoins and altcoins to stablecoins (usdt, usd, busd, usdc, etc.).
That is what we did:
- invested $ 1k and bought 0.31 btc on the signal (green diamond)
- using the system increased the number of btc from 0.31 to 2.43
- on the red diamond signal ($ 56,000) sold all our btc and alts
- 2.43 btx x 56,000 $ = 136 thousand dollars (136x)
As a result, by investing $ 1k and opening only 7 trades, we made money - $136 000
The second way, if you failed to buy at the bottom of the market (with the appearance of green diamonds)
If you failed to buy bitcoin on the spot when green diamonds appear, you can open regular futures and margin positions when blue areas appear (for example on a regular Binance account USDT - M).

Let's look at the situation, there is a blue area on the chart, this is a signal to open a position with the leverage.
Once the weekly candle has closed (UTC: 00:00 weekly candle closing time) and the blue area remains on the chart, you should open the futures usdt-m position with leverage 2x.
On the chart, we noted one of our last positions, which brought 300% profit. Since we used leverage our result is about 600%.
Most likely, the bull market is not over and according to many models, the maximum market is at 140 - 200 thousand dollars. Therefore, with this system you can get up to 700% of potential profits, successfully reach the end of the bullish market, save your results and get new signals to buy!

