Pump Tracker Instruction
By Yaroslav Krasko Updated September 1, 2024
BikoTrading Academy
Pump Tracker is one of our flagship automated trading systems. The system by analyzing various metrics identifies and shows trades with a good risk-reword ratio.
KEY ISSUES:
What do the attributes of the indicator mean?
To begin, let's make it clear what the symbols of the indicator mean. The first thing you should pay attention to is that you have access to two versions of the indicator: Pump Tracker 1.1 and 1.2
The Pump Tracker 1.1 version looks like in the chart below and in fact consists of 2 main lines (green and white). When crossing the white line by the green (bottom - up), this is a possible signal to open a position. At the moment of crossing the lines, the system additionally changes the background color to green. If the lines intersect in the opposite direction, it means that the position may be closed. The green background color also disappears at this time. By analyzing the distance between the lines, you can understand almost 100% accuracy the time of the signal to open or close the position. If the lines are close enough, you should check the schedule every day.
![]()
The Pump Tracker 1.2 version looks like in the chart below. The second version of the indicator duplicates the signal and projects it on the chart itself. This version was created solely for more comfortable defining of opening and closing points.
![]()
P.S. You will be additionally informed about the appearance of signals in advance in the Discord group.
How to open and configure the indicator?
1.Register and log in on the site https://www.tradingview.com/
2.Send us your nickname

3.After that, we provide you a subscription depending on the purchased package.
4.If you have been granted access, go to the CHART section

5.Open a BTC / USDT trading pair on the Binance exchange (this exchange is the most liquid, so it is important to choose it for the correct operation of the indicator, you can open trades on any exchange !!!)
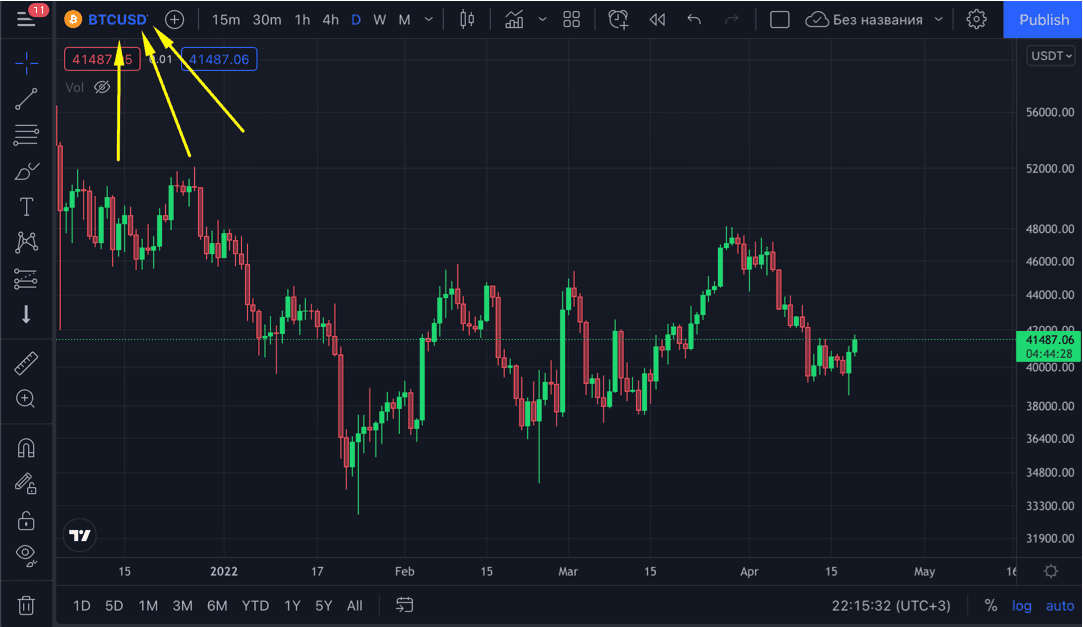
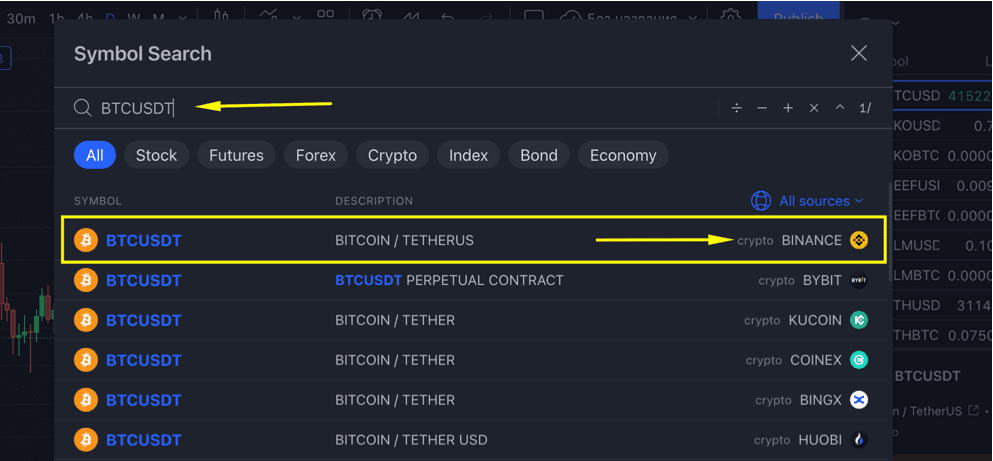
6.Once the chart is open, select the daily timeframe (this is necessary because the algorithms work only on this timeframe)

7.Next, at the bottom of the chart, select the logarithmic display of the chart.
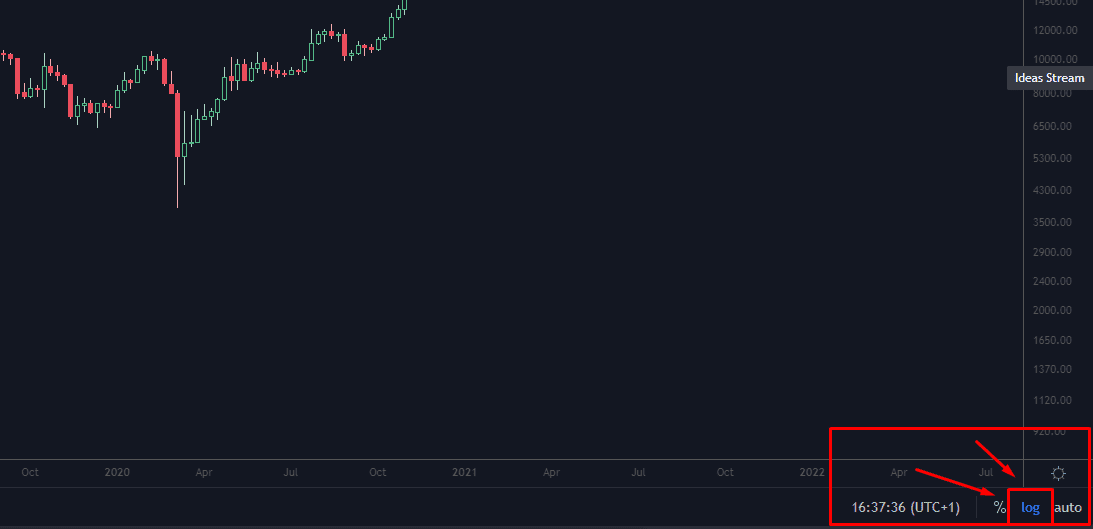
8.The chart has been set up, now go to the Indicators tab, on this tab you will have a section - Invite-only scripts, go to this section, it will display indicators called Pump Tracker 1.1 and Pump Tracker 1.2, Click on it!
![]()
9. That's it, these indicators should open on your chart and be ready to use.
![]()
For comfortable use, we recommend using a candlestick display of the price.
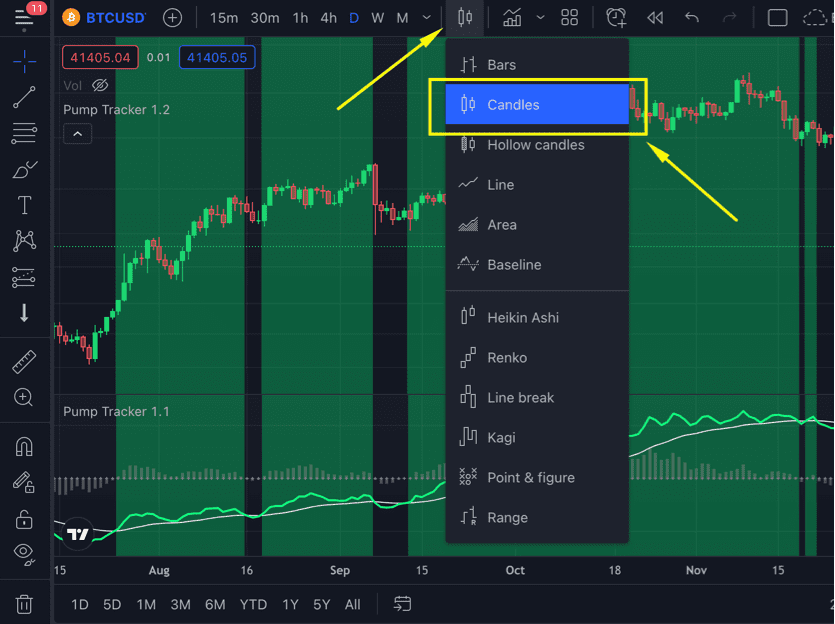
How to open and close trades!
The principle of opening and closing trade is quite simple. If after closing the day candle there is a green background, it is a signal to open the position. The position is closed on the same principle, if the day candle is closed without a green background, it is a signal to close. The day candle closes every day at 00:00 UTC time.
Now let's look at an example. In the chart below, we see that after closing the day candle, the green background remained on the chart. The day candle closed at $35,381. At that point we opened our position (bought Bitcoin).
![]()
Then, after a long growth, the day candle closed without a green background. This happened at a price level of $45,901. During this time, we closed the position and earned +29% to our balance sheet. Or +58% using leverage x2.
![]()
Enhance your trading opportunities with this daily timeframe strategy, delivering exceptional results.

