How to identify the Bitcoin bottom using indicators
By Yaroslav Krasko Updated April 26, 2024
BikoTrading Academy
Each market participant tries to predict the movement of the cryptocurrency price and earn hundreds of percent from it. Stop and think how many times in the last week/month you tried to predict or guess the movement of Bitcoin price. I'm sure it was dozens or even hundreds of times.
In this article, we will analyze all these questions and show real cases of how you can find the lowest points of the cryptocurrency market using indicators.
KEY ISSUES:
Is it possible to determine the bottom of Bitcoin and Altcoins with the help of indicators?
A question that thousands of traders and analysts are trying to find an answer to. Personally, I can definitely say that it is possible. And the main way by which this can be achieved is statistical probabilities and market patterns. Don't be surprised by the words in the last sentence, it's easier than it seems. In order to prove it, let's move to the real facts.
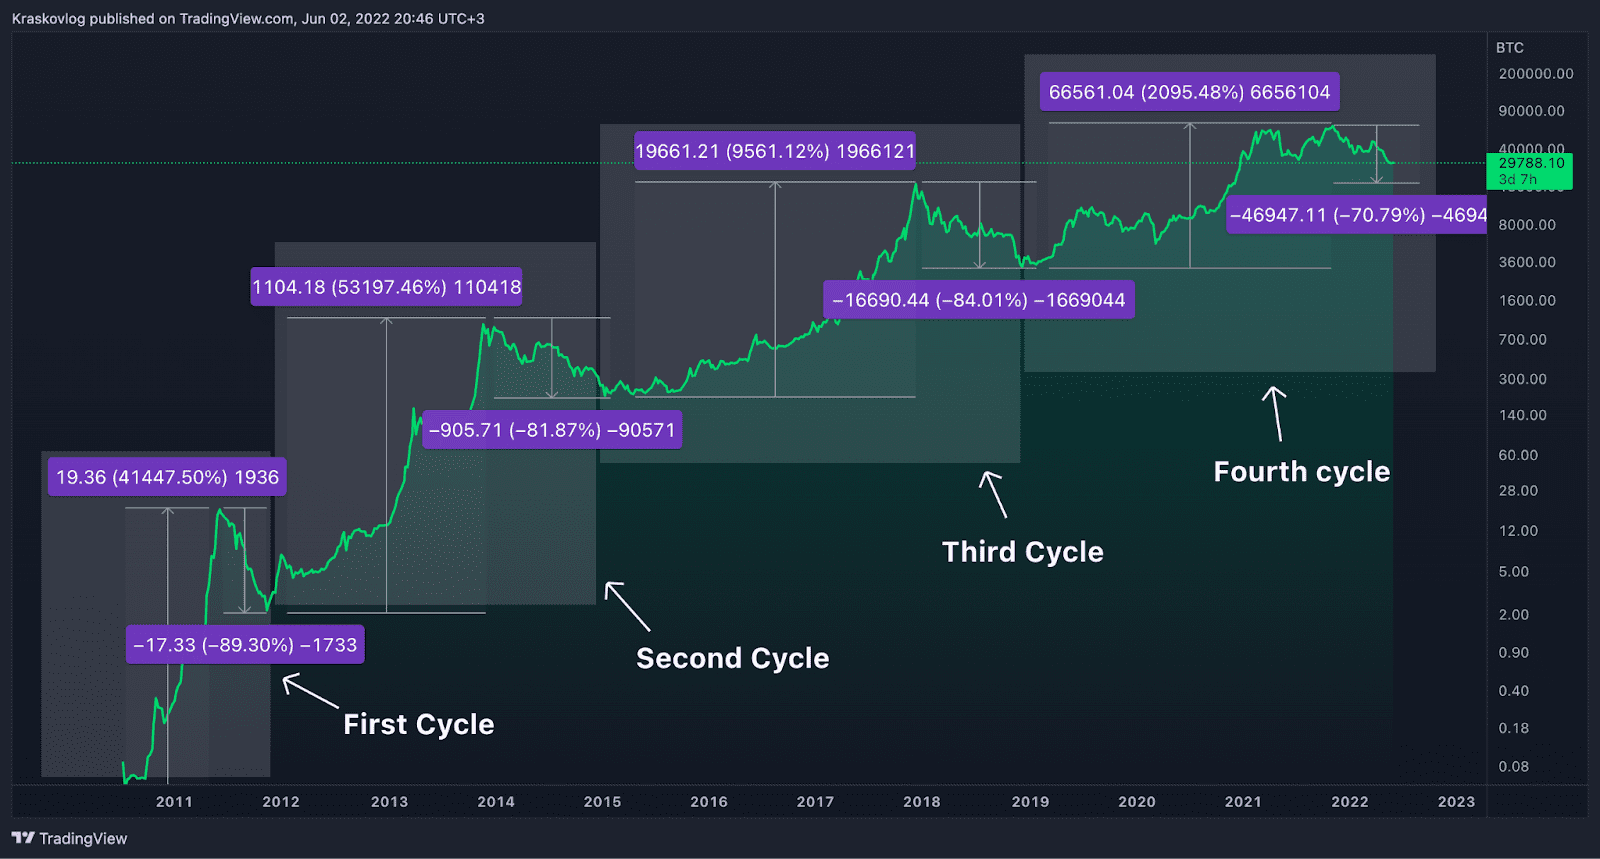
The first thing to note is that all markets are cyclical. And the Bitcoin chart is a great example of this. Above I have added a logarithmic chart of Bitcoin for the last 12 years (full bitcoin bottom history). Even if you do not have enough experience in trading and investing, you can determine trends and regularities from the chart shown above.
What are the regularities and features that we can determine?
- The first thing we can pay attention to are cycles, we can clearly distinguish the main cycles of the cryptocurrency market. Bitcoin is now in its 4th cycle. One cycle lasts about 4 years.
- The second thing you can pay attention to is the trend or phases of the market. Each cycle consists of a descending and an ascending phase. The descending phase lasts approximately 1.5 years. The ascending phase lasts 2.5 years.
- The next important feature that we can highlight is that each bearish phase ended after an 80% drop in price.
- Another feature is that with the growth of the market capitalization and with each subsequent cycle, the ascending and descending phases decrease in %. That is, looking ahead, I can say with high probability that the current downward phase will end after a 70-75% drop. Likewise, the next upward phase will no longer be able to please us with 2000% growth.
That's how, with the help of such analysis and data, we have: vision, certain statistics and patterns of the market. With the help of such simple information, we can already roughly draw up our investment or trading strategy. A simple example: statistically, we know that every time the cryptocurrency market drops by 80%, it is always the best opportunity to buy cryptocurrency. Based on such statistical probabilities, we can predict future price behavior.
Methods of determining the bottom of the cryptocurrency market using indicators.
Below I have presented 5 simple examples of how you can identify the bottom of the cryptocurrency market. I know that almost half of the readers want to know where to buy altcoins. Although it's challenging to precisely predict the Bitcoin bottom, analyzing technical indicators can provide valuable insights into potential buying opportunities. Since 99% of all coins are fully correlated to Bitcoin, all the presented methods will be relevant for almost all cryptocurrencies. That is, if it is a good time to buy Bitcoin, then it is also a good time to buy altcoins.
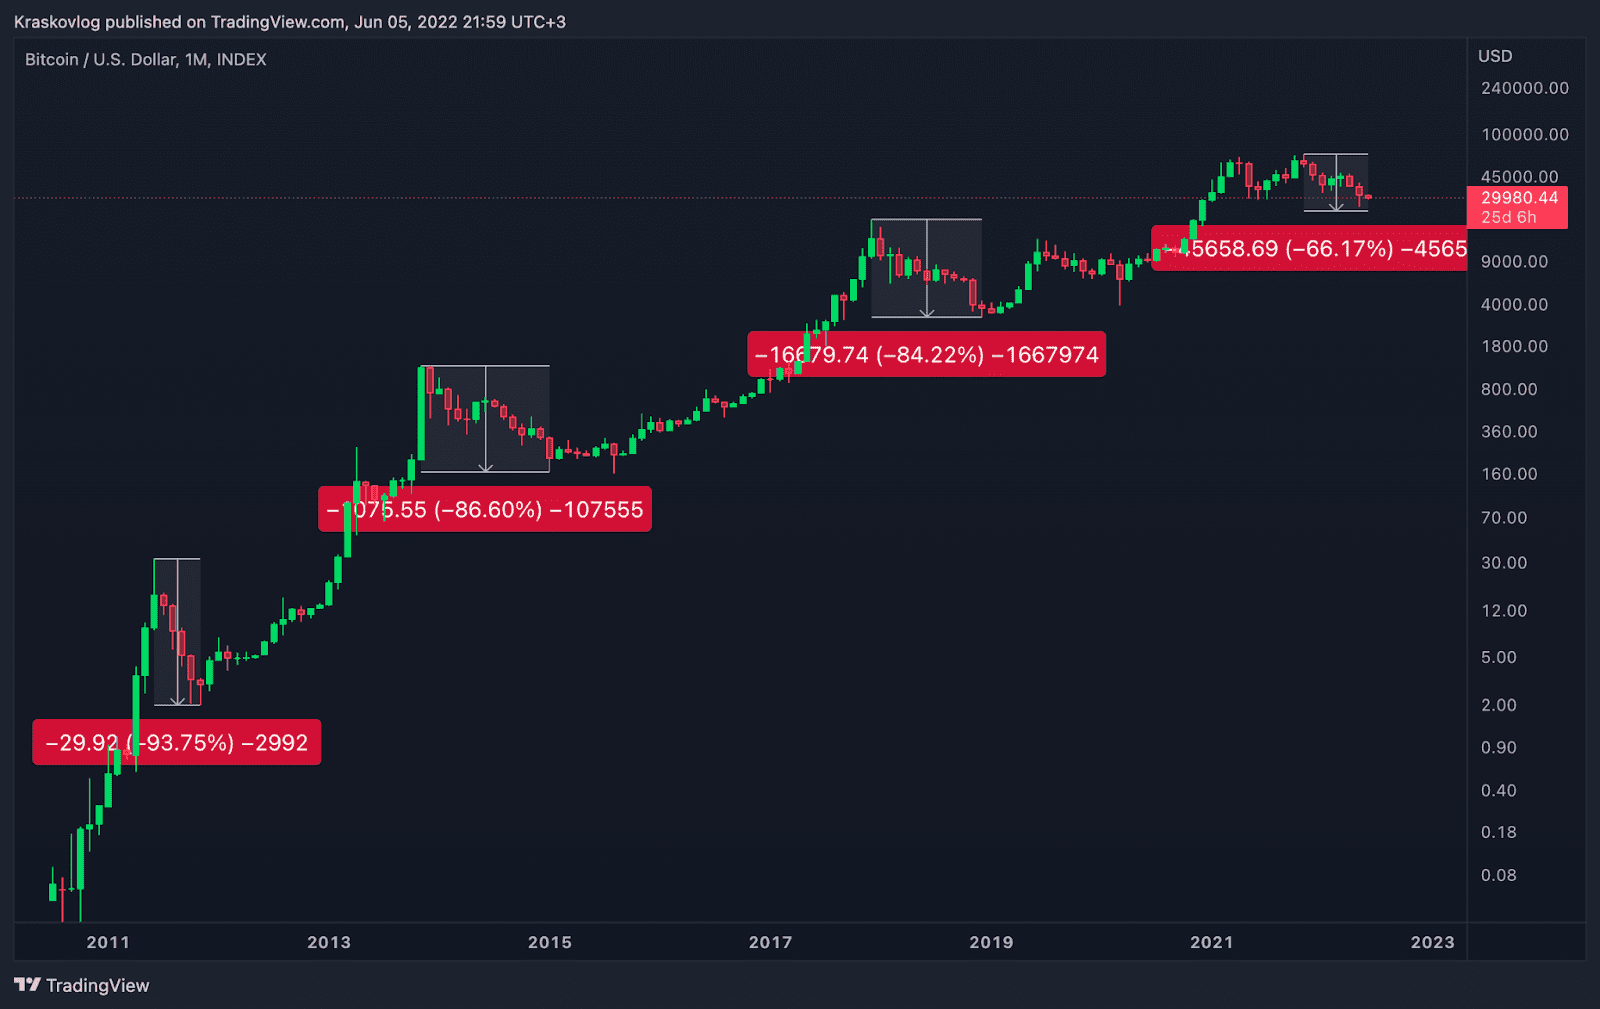
The first method - a fairly simple but effective method, buying cryptocurrency after a 70-80% drop. It is known that every cycle of the cryptocurrency market ended after an 80% drop. Has crypto bottomed at such a point? Yes! And it was after such a decline that the best time to buy cryptocurrency came. In the case of using this method, I recommend using the DCA strategy. This will allow you to get a good average purchase price almost at market lows.
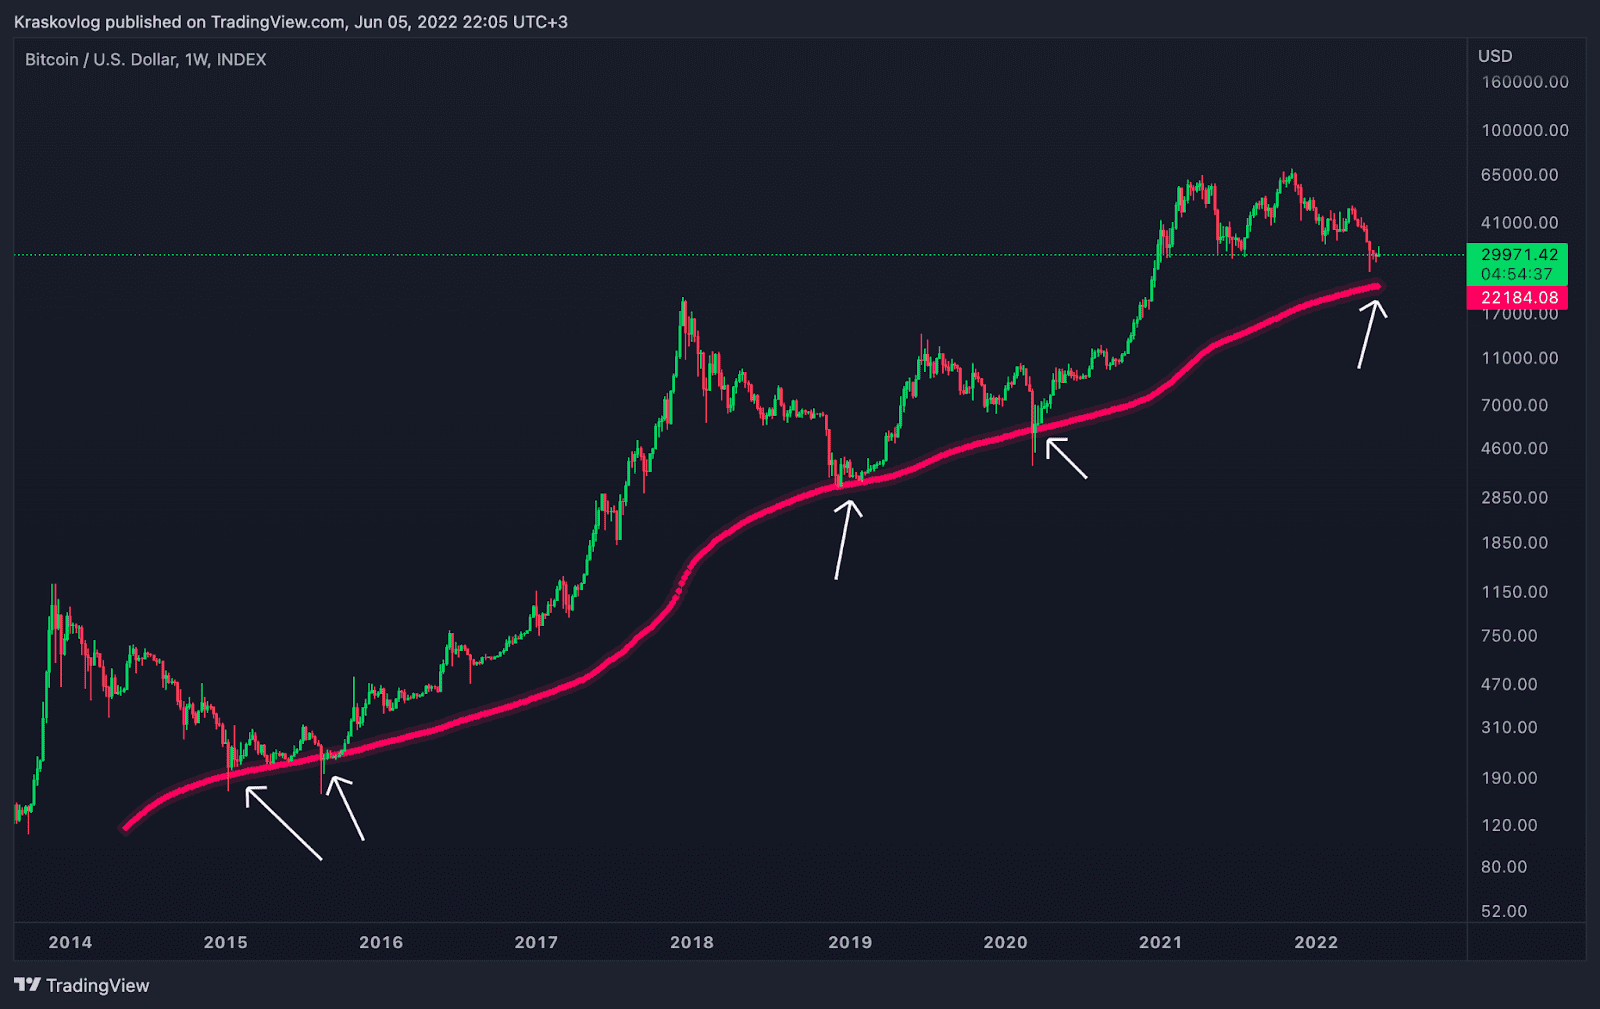
The second method - use of the 200 moving average price (MA) of the weekly period. It is known that the price constantly returns to its average values. In the case of the cryptocurrency market, the price always returned to the average values of the 200-week period. At the moment, the 200 moving average of the weekly period is at the price mark of $22k. $22k and anything below is a great opportunity to buy bitcoin. Combined with the DCA strategy, you can get a better average purchase price. You can find this and other indicators on the TradingView platform.
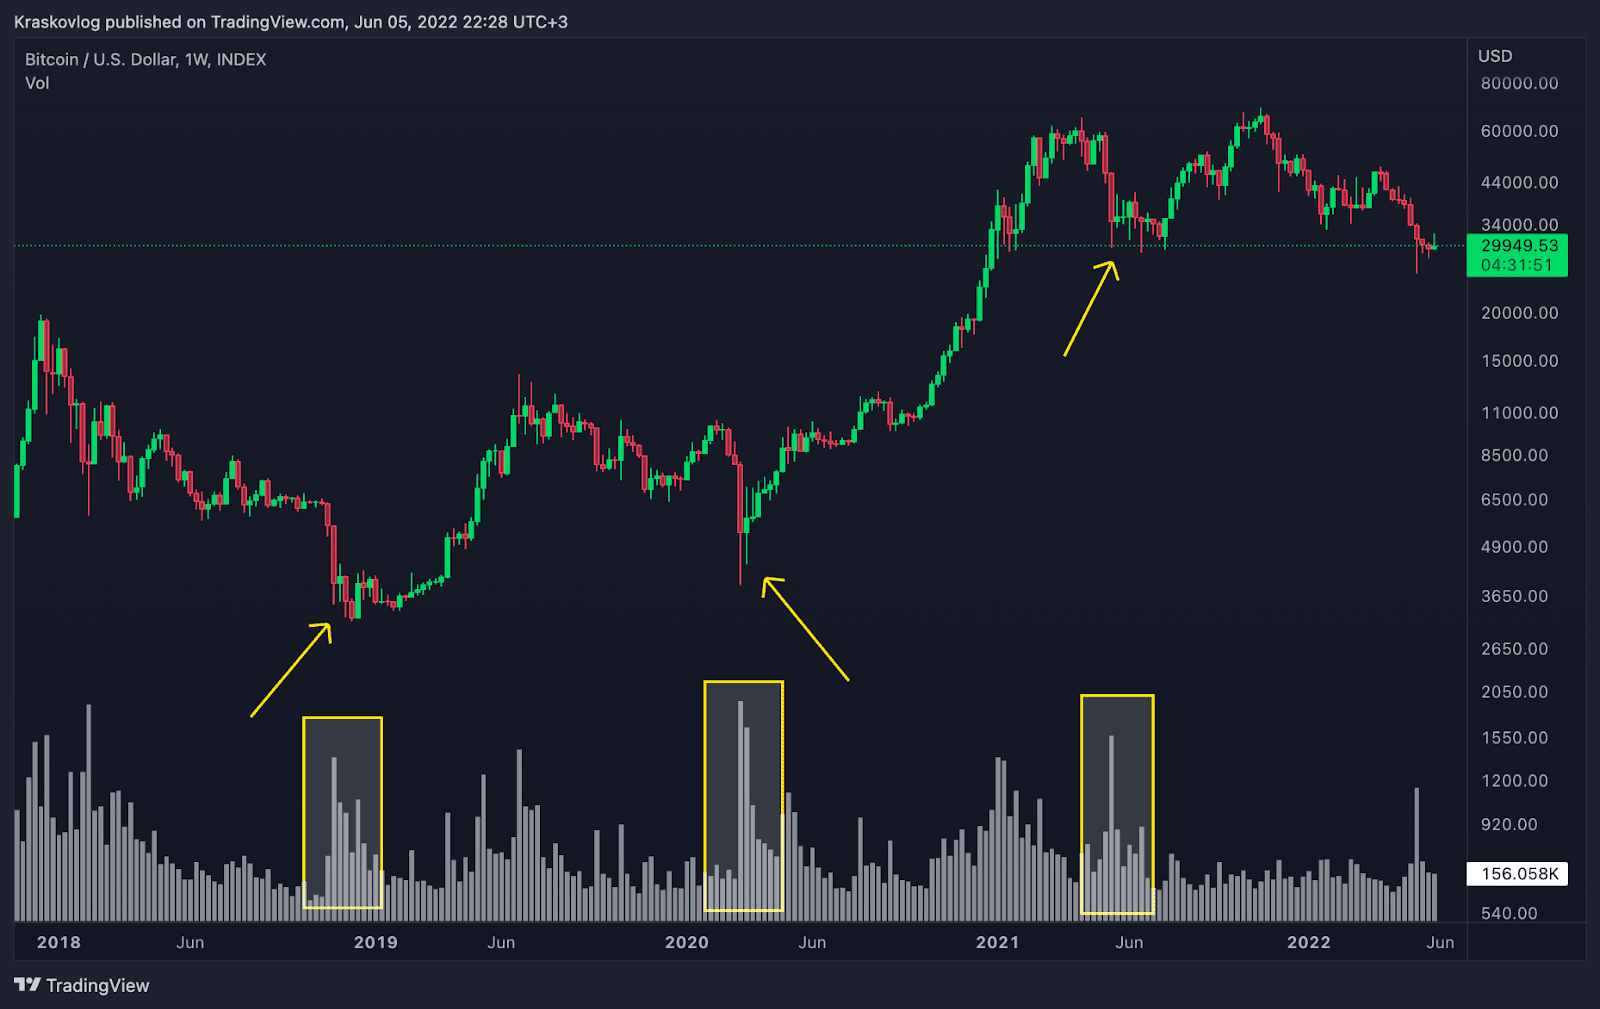
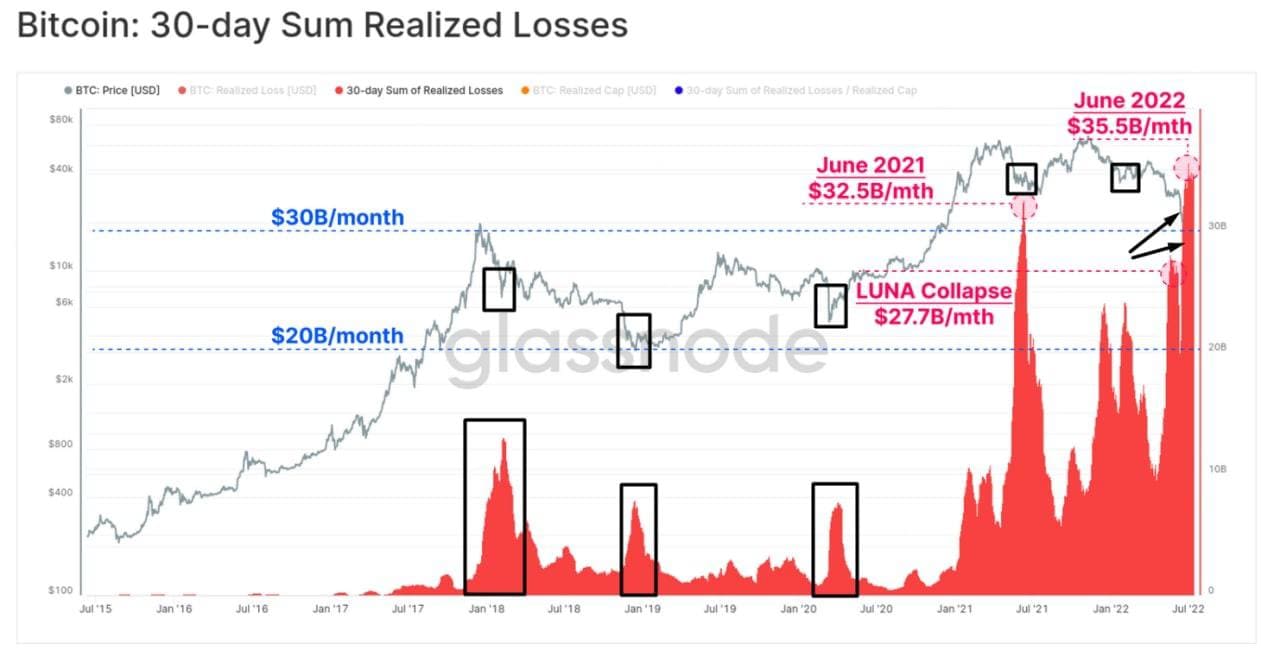
The third method - liquidations. During a sharp drop in price, a large number of market participants liquidate due to open credit positions or also sell cryptocurrency to themselves at a loss. Such periods are also often called market capitulations. Periods of market capitulation are the best time to buy cryptocurrency. In order to identify such periods, we can use a normal volume indicator, since during the capitulation of the market there is a paranormal trading volume.
When there's a significant increase in trading volume accompanied by a drop in price, it could suggest capitulation (a selling climax), which might indicate a potential bitcoin market bottom.
In addition to this method, we can use the realized loss indicator.
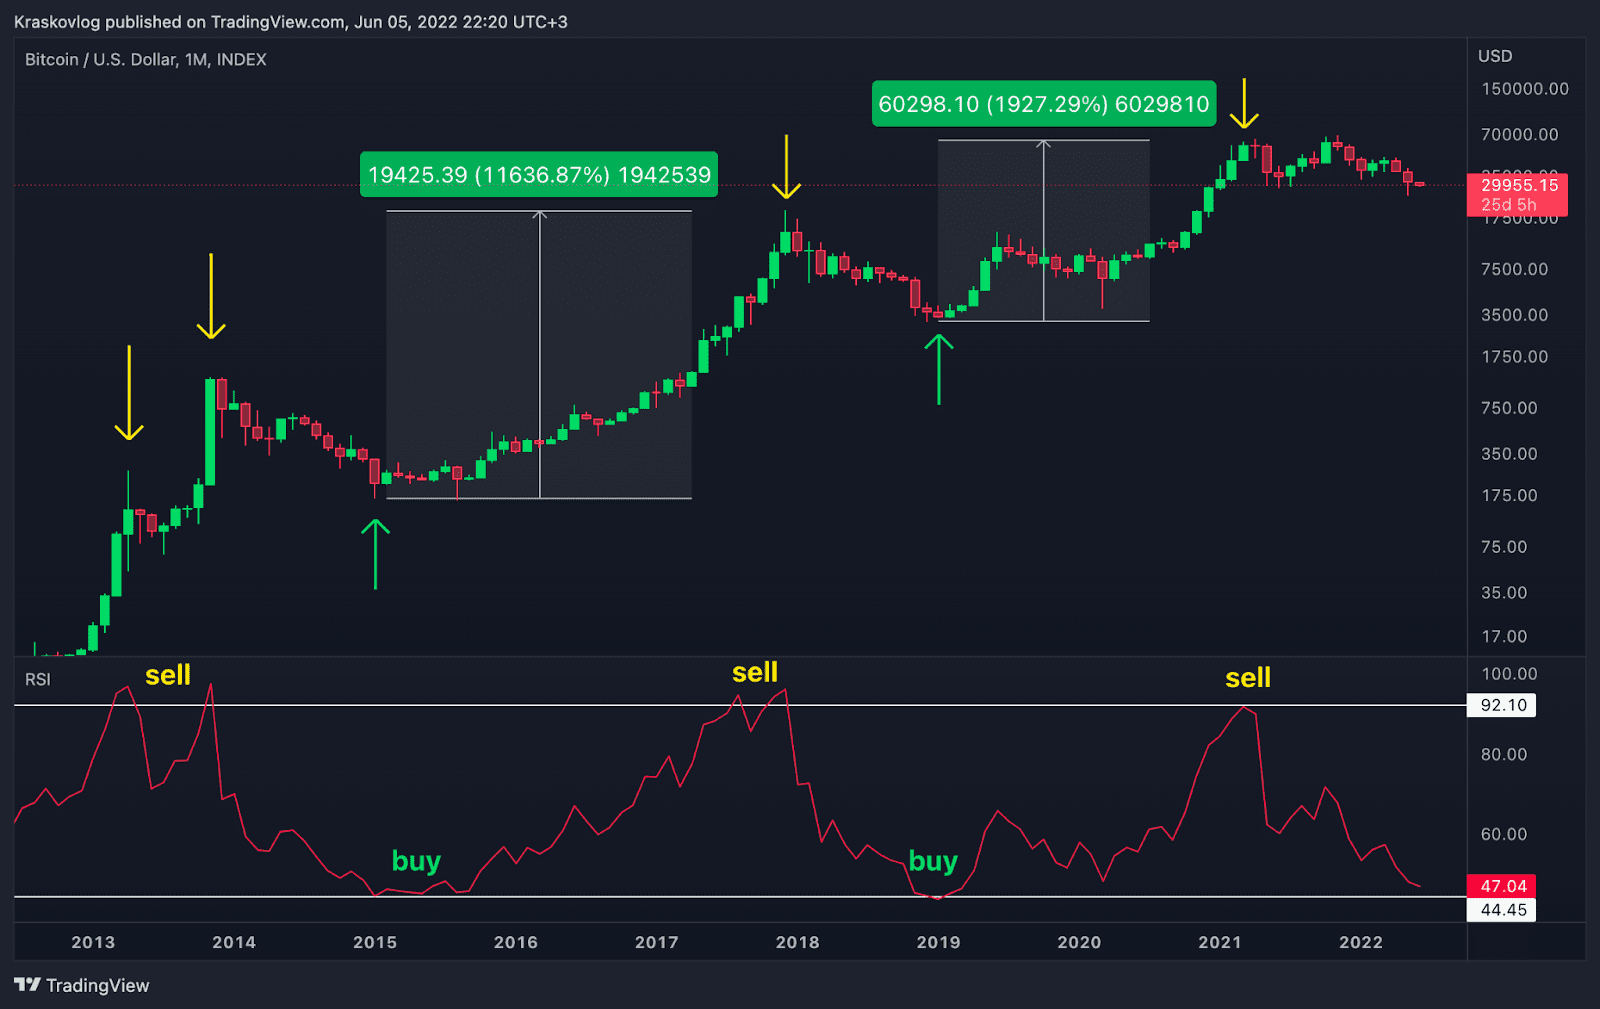
The fourth method - determining market lows and highs using the Relative Strength Index (RSI). The RSI indicator determines the oversold and overbought areas of the market. If we switch to the monthly timeframe and turn on the RSI indicator, we will see an interesting pattern. Every time the relative strength index on its scale reached the mark of 44, these were the lowest marks of the cryptocurrency market. Conversely, when the indicator reached 92, it was a good opportunity to sell.
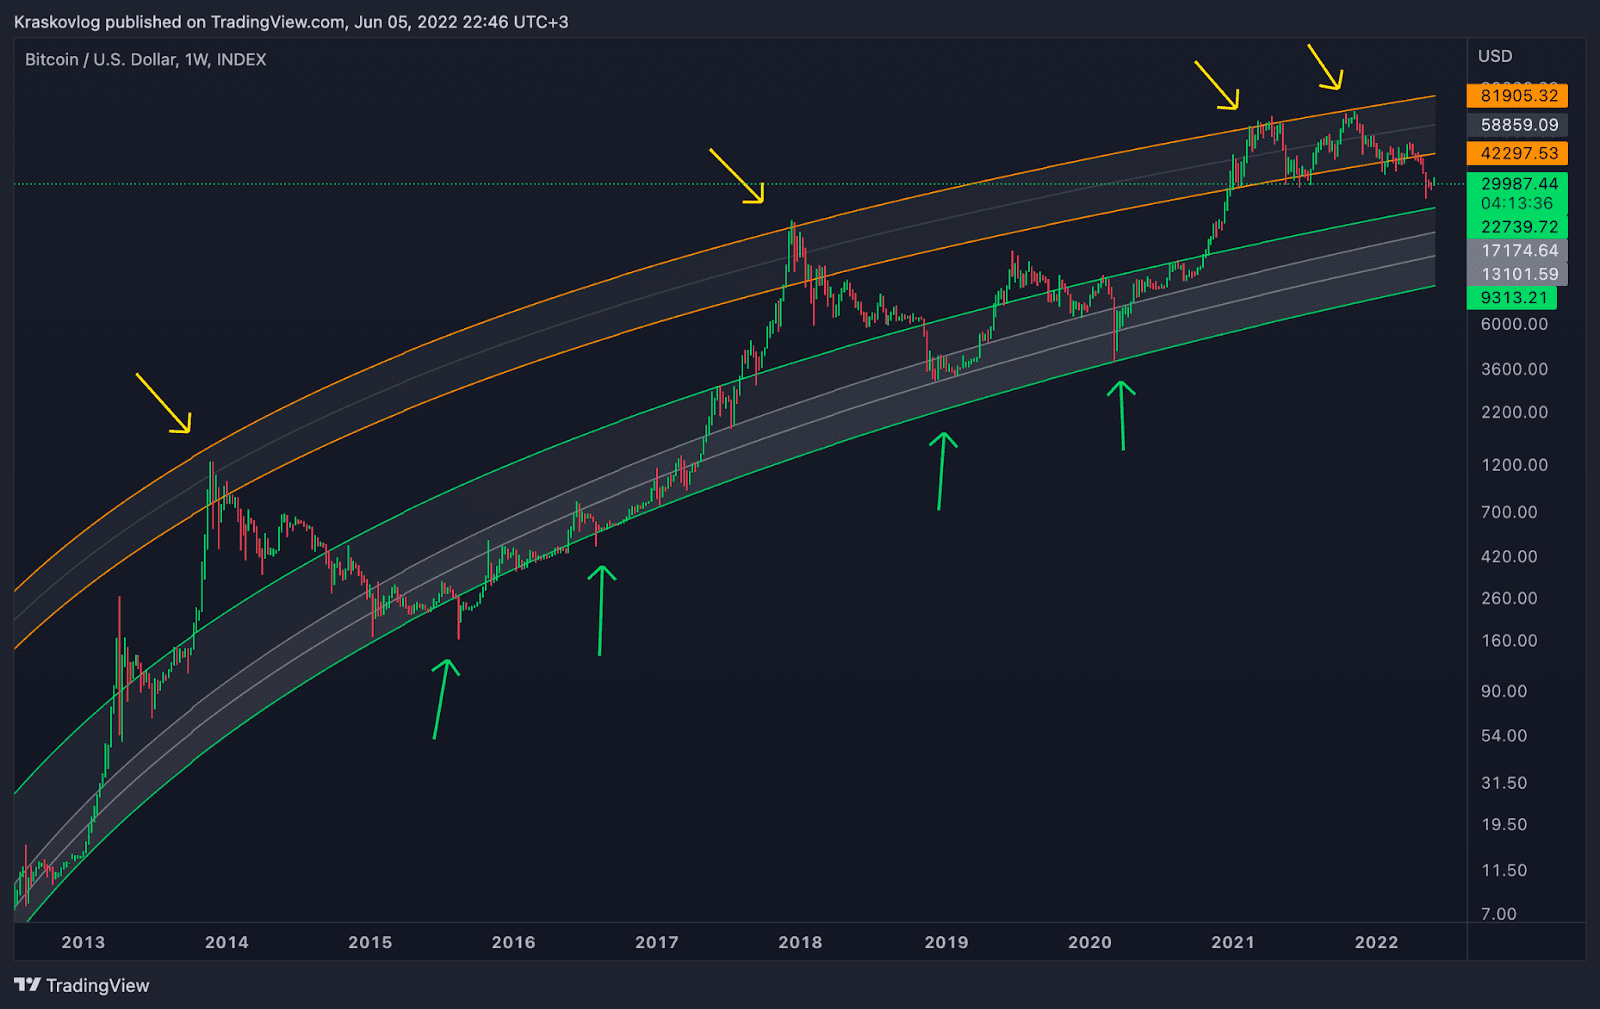
The fifth method - logarithmic regression. Another good way to determine the approximate levels of highs and lows of the market. If you analyze the chart below, you will see that the lower zone was a good opportunity to buy, and the upper zone was a good reference point to take your profit and be ready for the upcoming decline. By using this method with the DCA strategy, you can achieve almost perfect buying opportunities.
If you do not have any trading systems of your own, the presented methods will be a great guide in understanding the dynamics of the market and will certainly help you to significantly increase your capital.
Our methods for determining cryptocurrency market lows
Our team has its own unique trading indicators and strategies that allow not only to determine the crypto bottoms and the maximum of the market, but also to earn additionally with the help of short-term futures strategies.
The first and most important strategy is the Greenwich strategy. This is a unique ready-made trading system that consists of several trading strategies. Over the past 2 years, the system has increased the initial capital 130 times and earned $130k from $1k. The main feature of the strategy with which it is possible to receive excess profits is the use of Bitcoin futures.
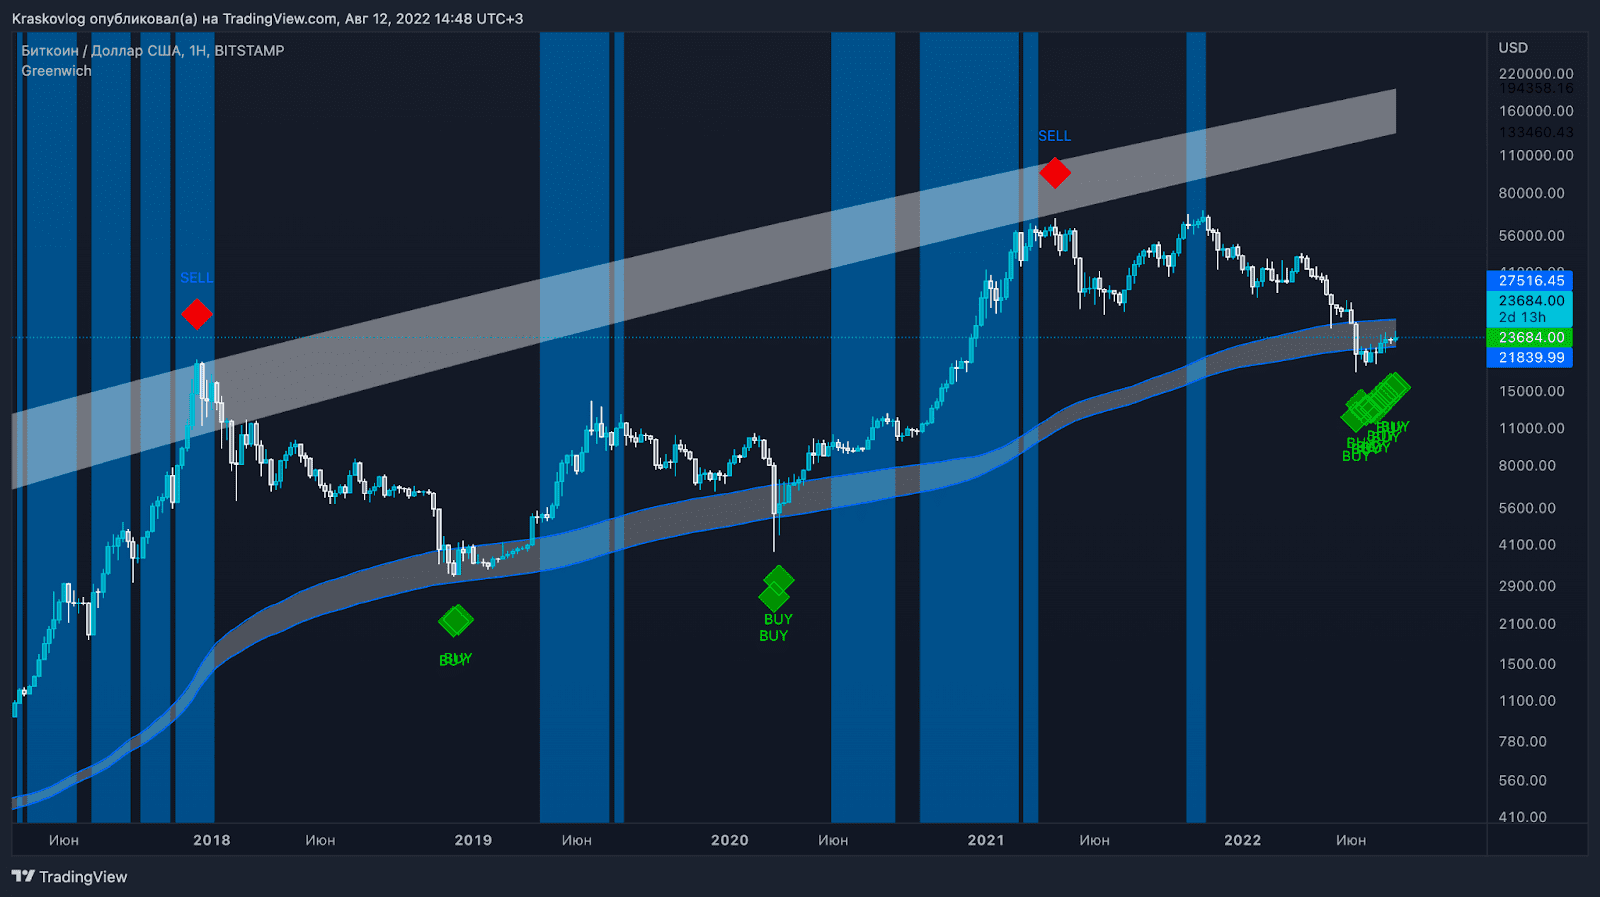
At the same time, we use other developments with the help of which we more accurately determine the fundamental value of the cryptocurrency market. We also determine the market trend.
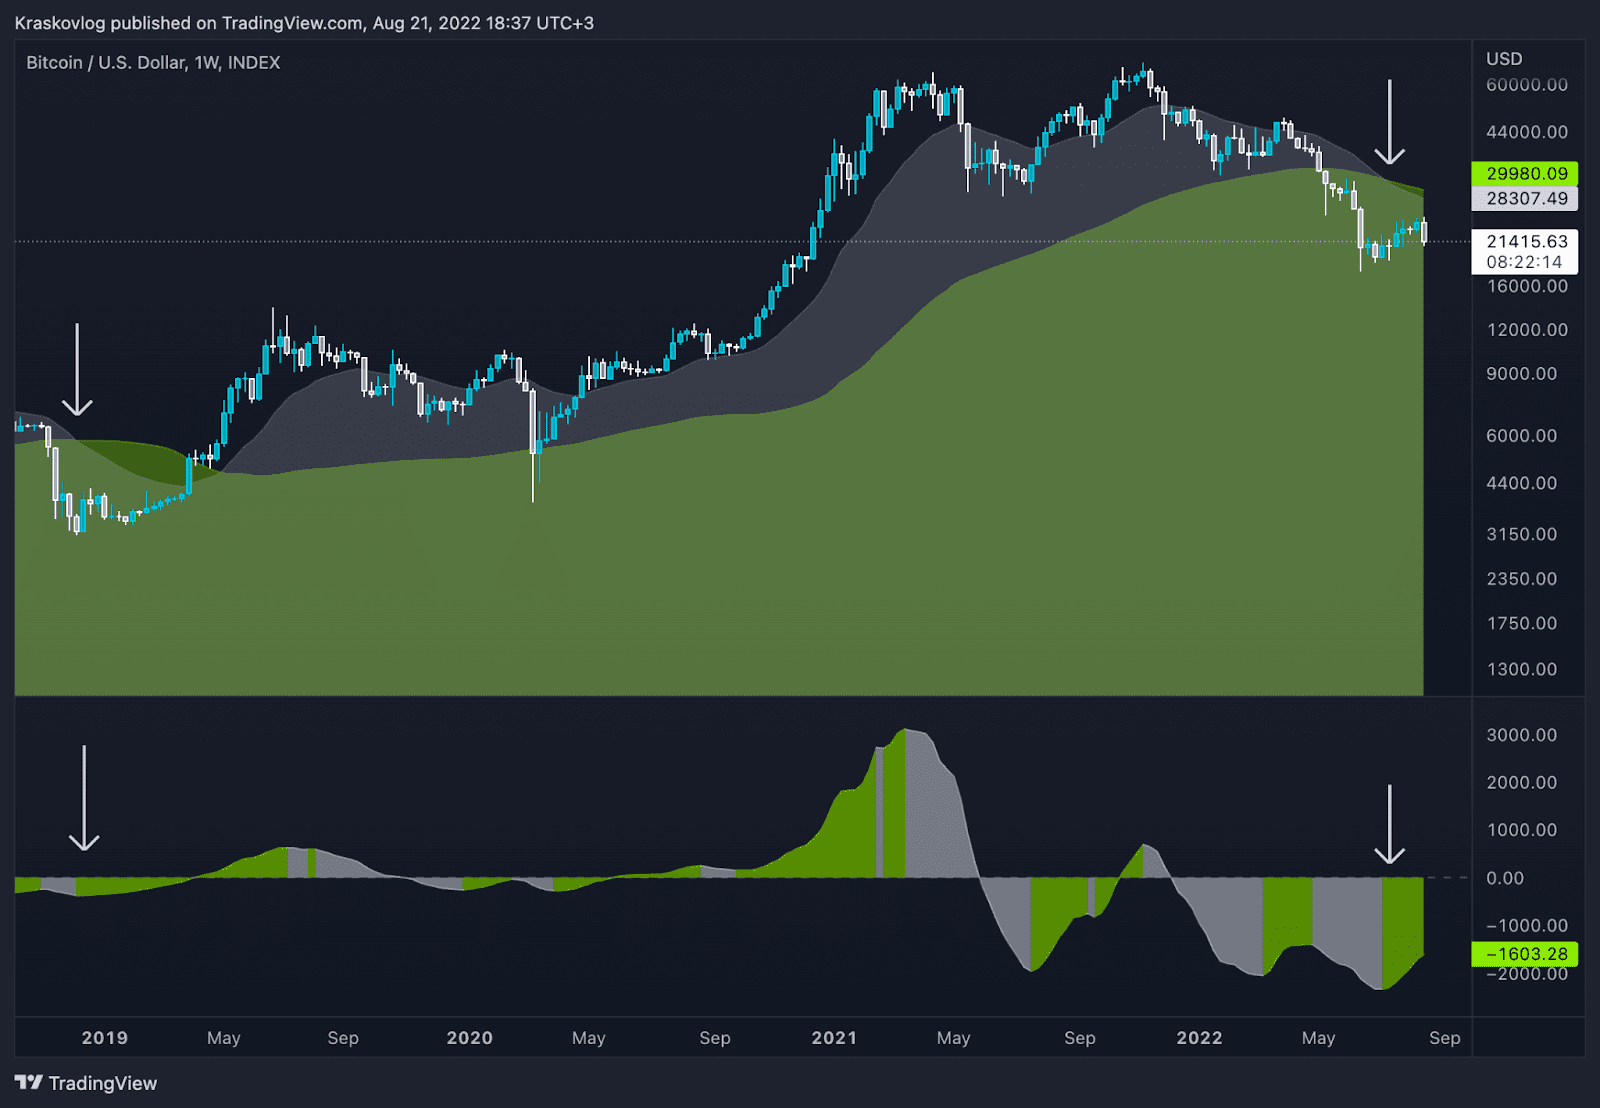
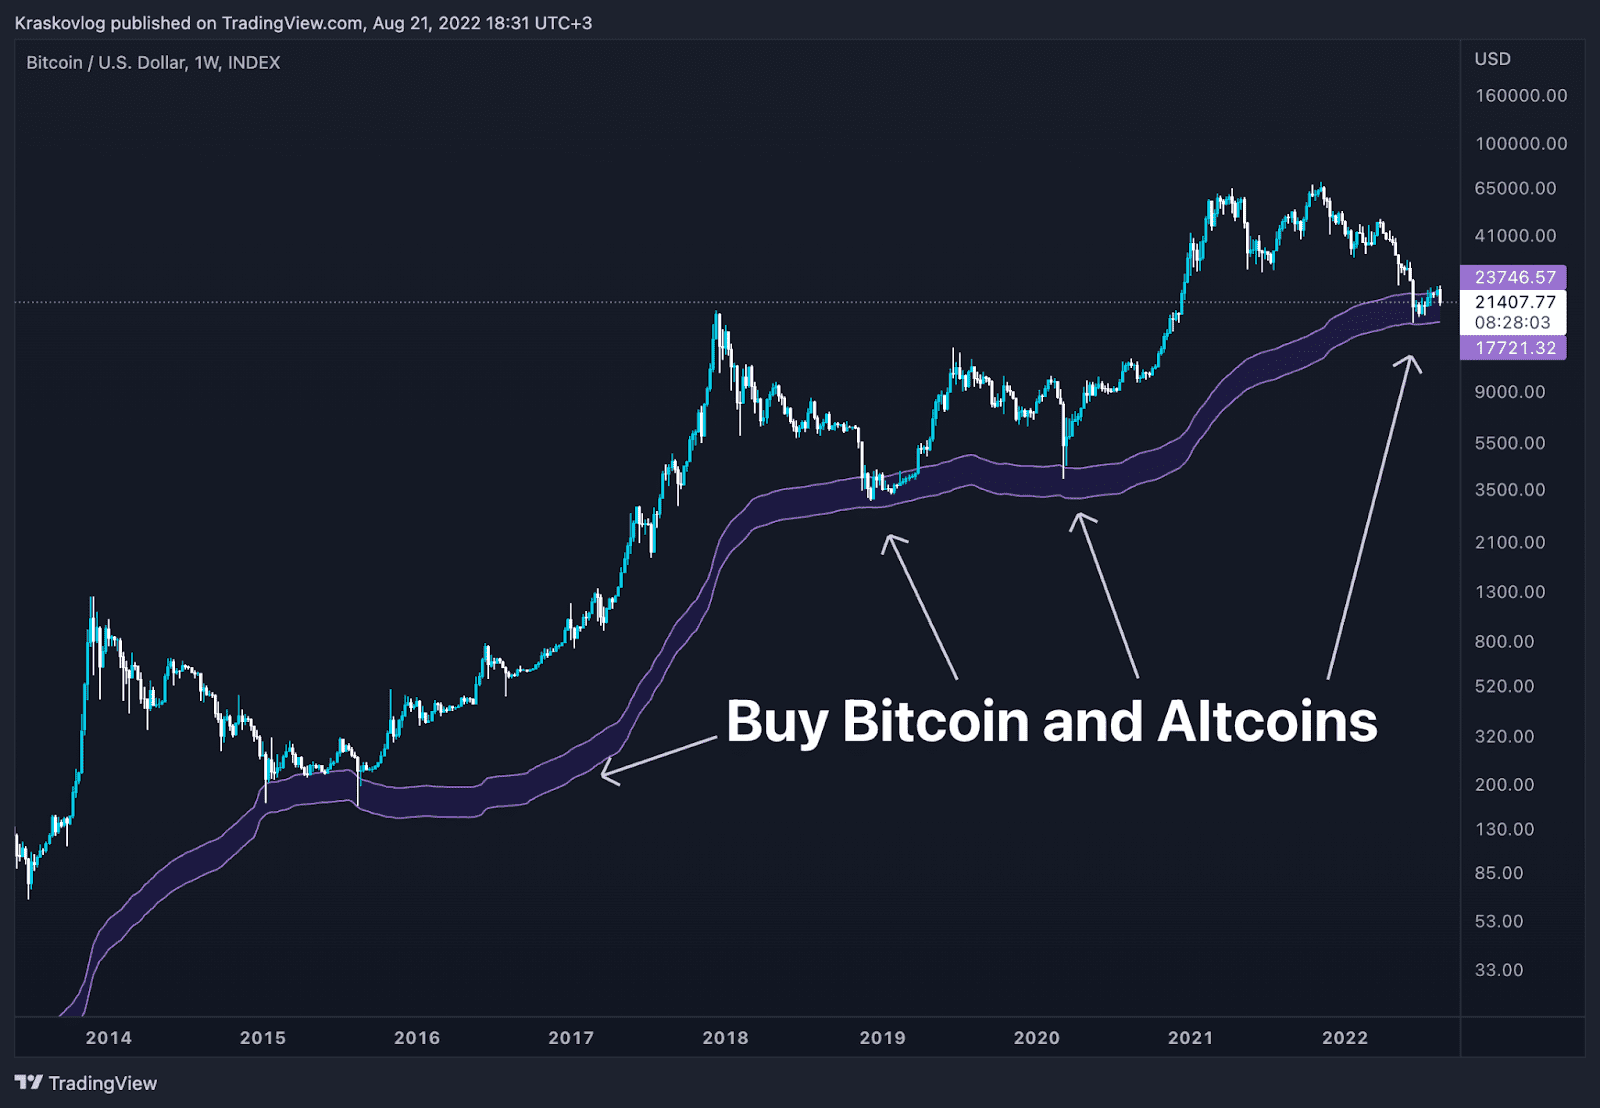
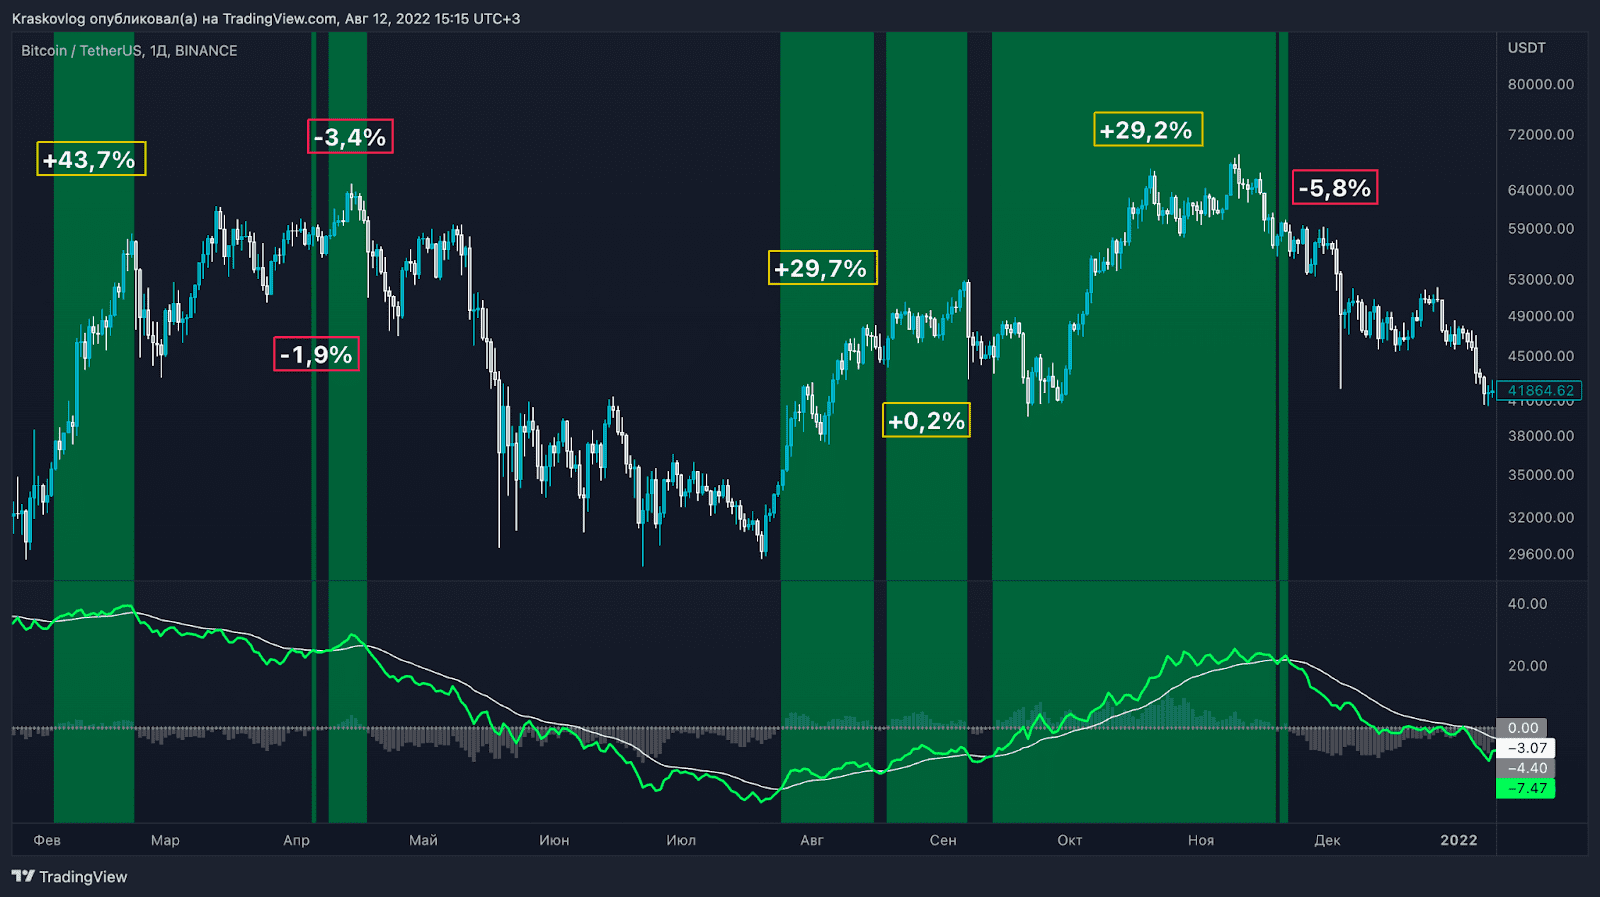
Remember:
- Confirmation from multiple indicators and broader market factors is crucial before buying and selling coins, expecting BTC bottom 2024-2025. Relying only on isolated indicator signs can be extremely risky.
- Always prioritize risk management by implementing a stop-loss order to minimize potential losses, even if you feel confident about identifying a market bottom or potential bitcoin double bottom formation. Remember, the cryptocurrency market is highly volatile, and no indicator can guarantee absolute success.
- Avoid focusing solely on short-term gains by trying to time the perceived market bottom. Bitcoin should be integrated into your overall investment strategy with a long-term perspective, irrespective of speculation about whether a definitive bottom has been reached.
Keep an eye out for positive developments within the Bitcoin ecosystem or broader market trends that could drive price increases, leading Bitcoin out of a bottom BTC phase. This could include advancements in technology, regulatory changes, institutional adoption, or macroeconomic factors.
The presented systems give us the opportunity not to guess the behavior of the price, but to mathematically and statistically calculate the probabilities of price growth and fall. With the help of defined indicators: win rate, risk/reward ratio, average profit, max loss, max dropdown, we already have defined mathematical expectations of trading systems in advance, as well as an established risk management system that limits the possibility of losing funds.
In the case of using indicators, you trust the real indicators and signals that you see on your own chart. Indicators are a completely different approach to trading. You don't listen to scam traders from different channels or your own intuition. And this is the right approach.
Рarticipants of the Greenwich program receive all presented systems and developments, having an opportunity to monitor if bitcoin has bottomed or predict its direction. If you want to get access to developments, as well as access to the closed Discord club, fill out the form below.


