All About Bitcoin Cycles: How to Earn 10-30X in This Cryptocurrency Cycle!
Have you ever noticed how everything moves in cycles? Welcome to the world of cryptocurrency trading.
KEY ISSUES:
Everything is cyclical: From nature to Bitcoin
Starting from the beginning, it's important to understand that all markets, including the cryptocurrency market, are cyclical. This is a law of life, reflecting patterns we see everywhere: in the change of seasons, in the rise and set of the sun, even in our daily moods and biological rhythms. In this article, we'll delve deeper into the cyclicity of the cryptocurrency market, specifically Bitcoin cycles, and most importantly figure out - how to make money on all of this.
Despite the large number of market participants, there is one common trait that unites every trader and investor, allowing to predict price increases or decreases: it's emotions. Fear and greed are the main drivers of the market. According to statistics, 95% of traders and investors in the cryptocurrency market lose their money, and only 5% come out winners. Understanding market psychology, and the ability to accurately identify periods of fear and euphoria in financial markets, will allow you to be in the winners' list.
Uncovering the cyclicity model
Now that you're familiar with the cyclicity model, it's crucial to analyze its components in detail and understand how this knowledge can be applied in the cryptocurrency market. Let's look at the different phases of the cycle.
The graph below presents the cyclicity model. It might seem like just another drawing from one of those boring books about markets, trading, and investments. But don't rush to conclusions!

Take a pause and memorize this chart well. Why? You'll be surprised when you see how identical this drawing can be to real-life examples we'll show you later.
1. Accumulation Phase
Smart Money: This phase is characterized by the asset price being in a "boring" position, without significant changes. At this time, ordinary traders and investors (retail players) often leave the market, creating an ideal moment for "smart money" (banks, hedge funds, big players) to buy the asset at a low price.
2. First Growth Phase
Institutional investors: At this time, the price begins to rise, but the growth is not intensive enough to attract the attention of the general public. "Smart money" continues to buy, preparing the ground for the next phase.
3. Euphoria Phase
Public: This is the most exciting part of the cycle, when the price rapidly rises, attracting a lot of attention from retail players. The media step up their work, and new market participants start buying large volumes of the asset, which further amplifies the price movement upwards. But what are "smart money" doing? They are selling their assets to new, inexperienced market participants.
4. Capitulation Phase
Capitulation: As a result, the time of crash comes. The price starts to fall, "smart money" have sold their assets. General euphoria turns into fear, and retail players, who bought at the peak, start to panic and massively sell their assets. This is called the "capitulation phase".
This model repeats again and again and works on all markets, without exception. Knowledge of cyclicity can help you understand when to buy, when to sell, and when to just sit and wait.
From Theory to Practice: Real Cases
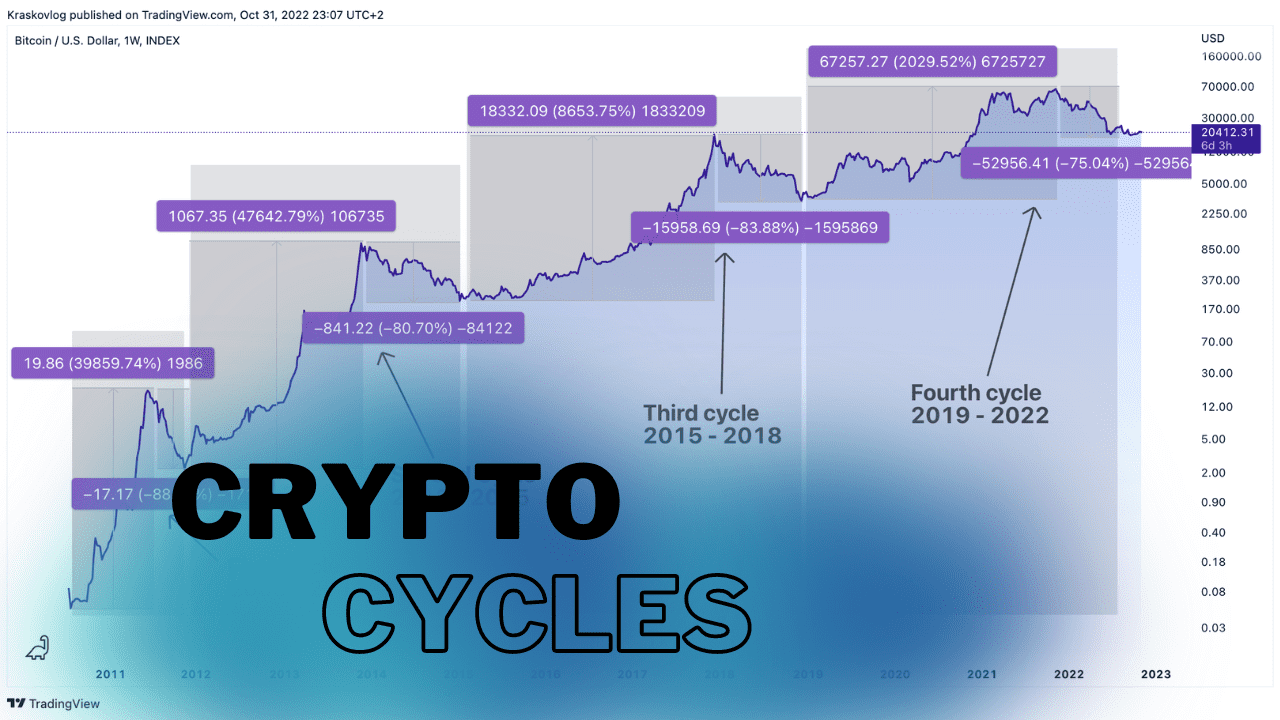
Now let's move on to real-life examples. The entire price history of Bitcoin is represented on this chart. Using the chart, we can clearly determine its cycles. On average, one cycle lasts four years, with the market in a bull trend for 2.5 years and a bear trend for the remaining 1.5 years.
Please note that these time frames are averages and may vary depending on many factors. However, overall, this pattern provides us with valuable insights into potential future fluctuations in the price of Bitcoin.
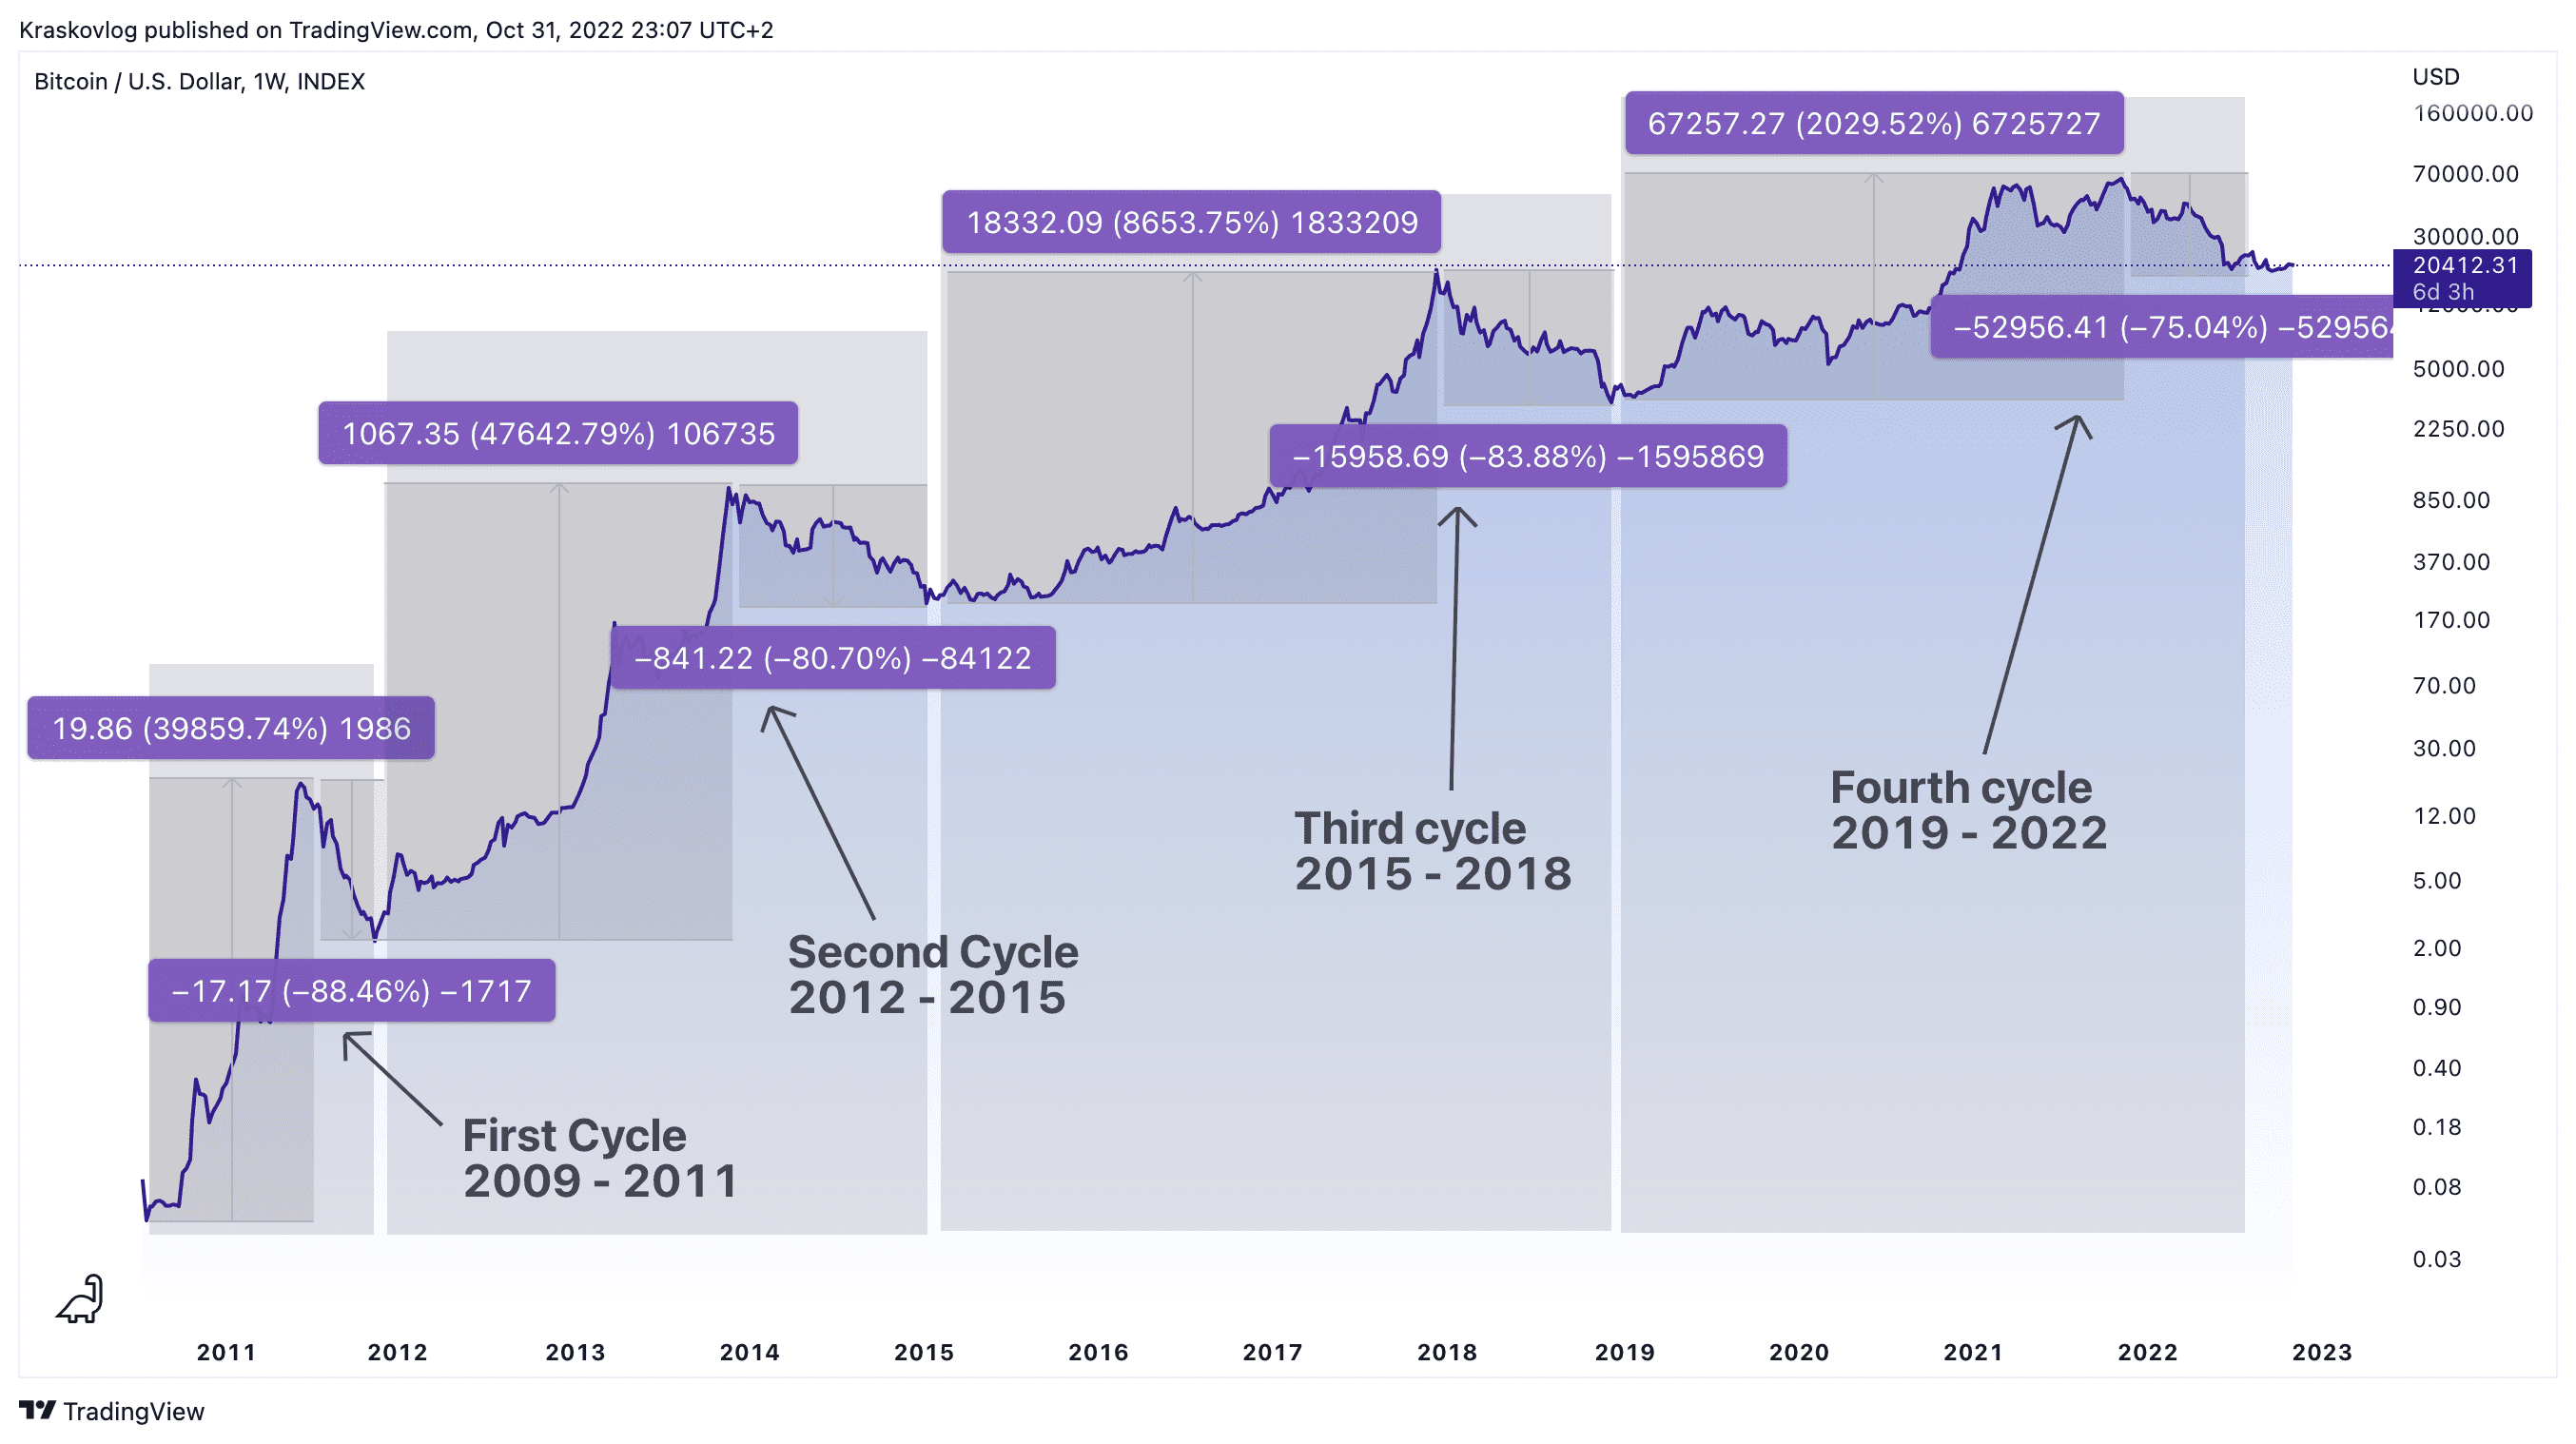
Next, we'll break down each Bitcoin cycle separately, but before we start, remember the first chart about the cycle model. Now compare real examples with the cycle model chart. Have you noticed how precisely real examples follow the cycle model chart?
First Bitcoin Cycle
BTC was mined on computers just for fun by enthusiasts without any regulatory institutions. From July 2009 to June 2011, BTC embarked on its first bull trend and reached a price of $18.5 from $0.05, which is a +64,000% increase.

Second Bitcoin Cycle
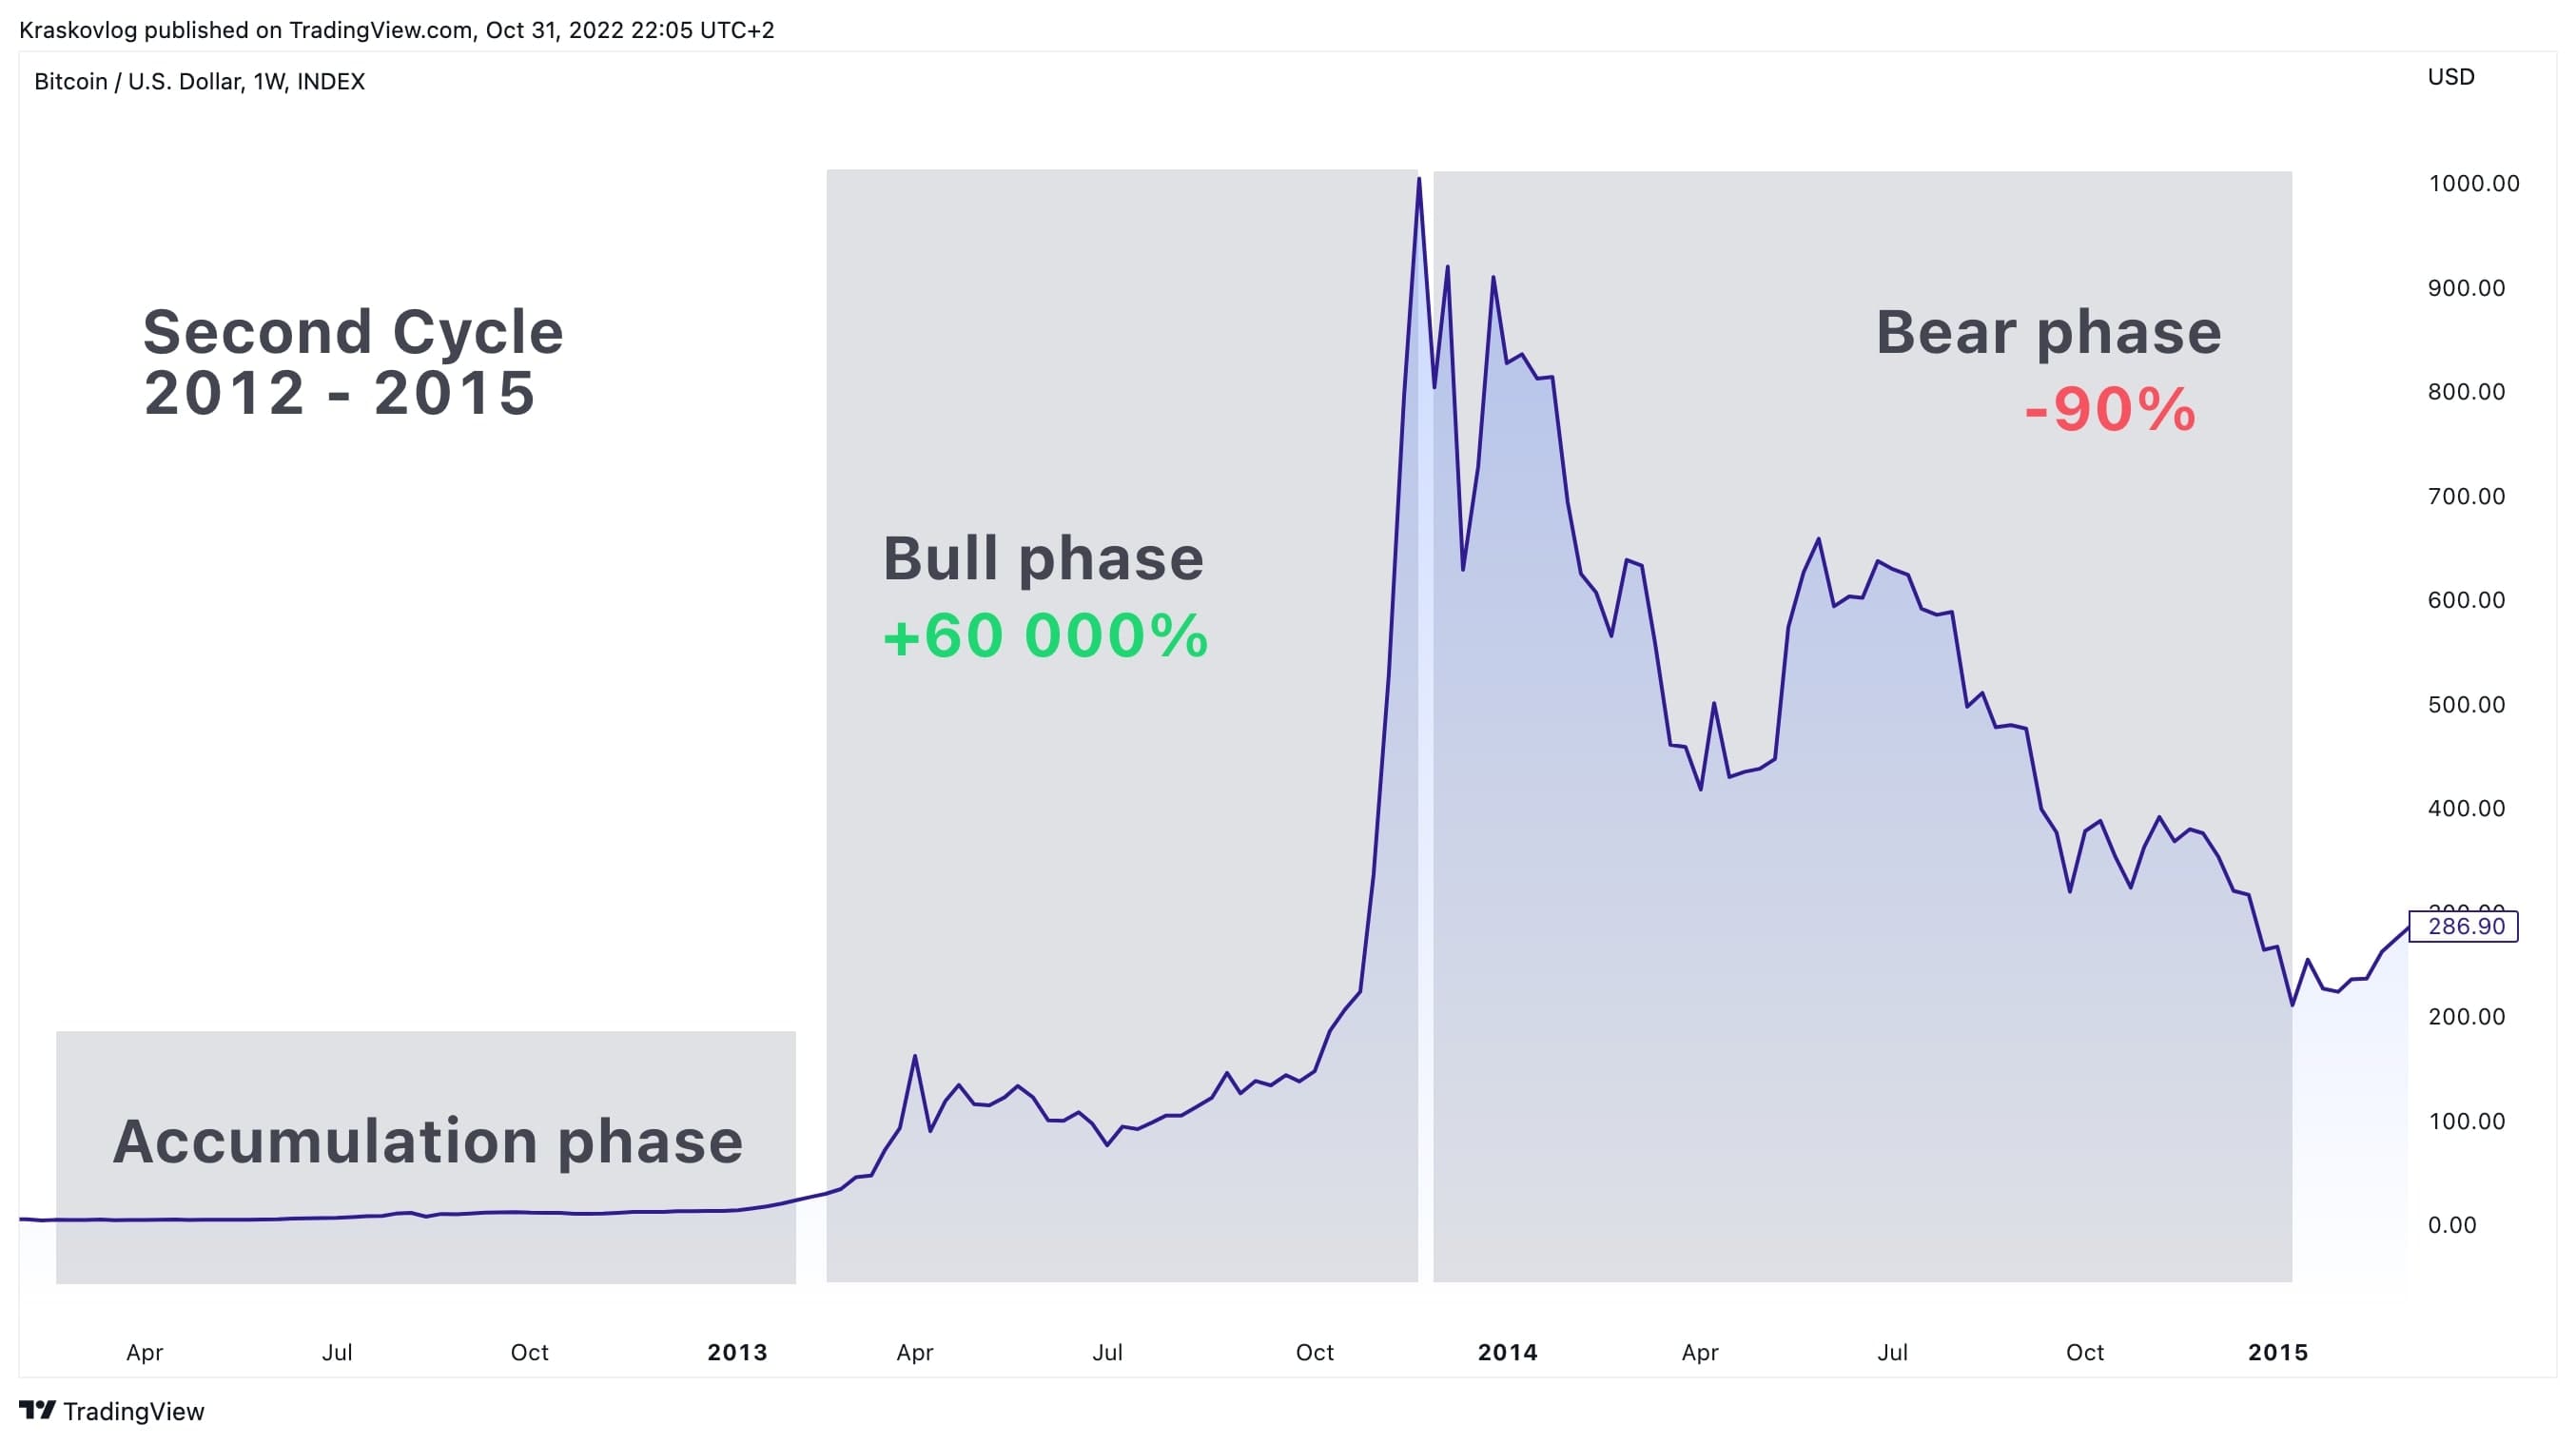
The BTC market reached its first all-time high, after which the first bear market began. After a correction of 93%, a new bull trend quickly began, and from November 2011 to November 2013, BTC rose from $2 to $1,240, an increase of +60,000%.
Third Bitcoin Cycle
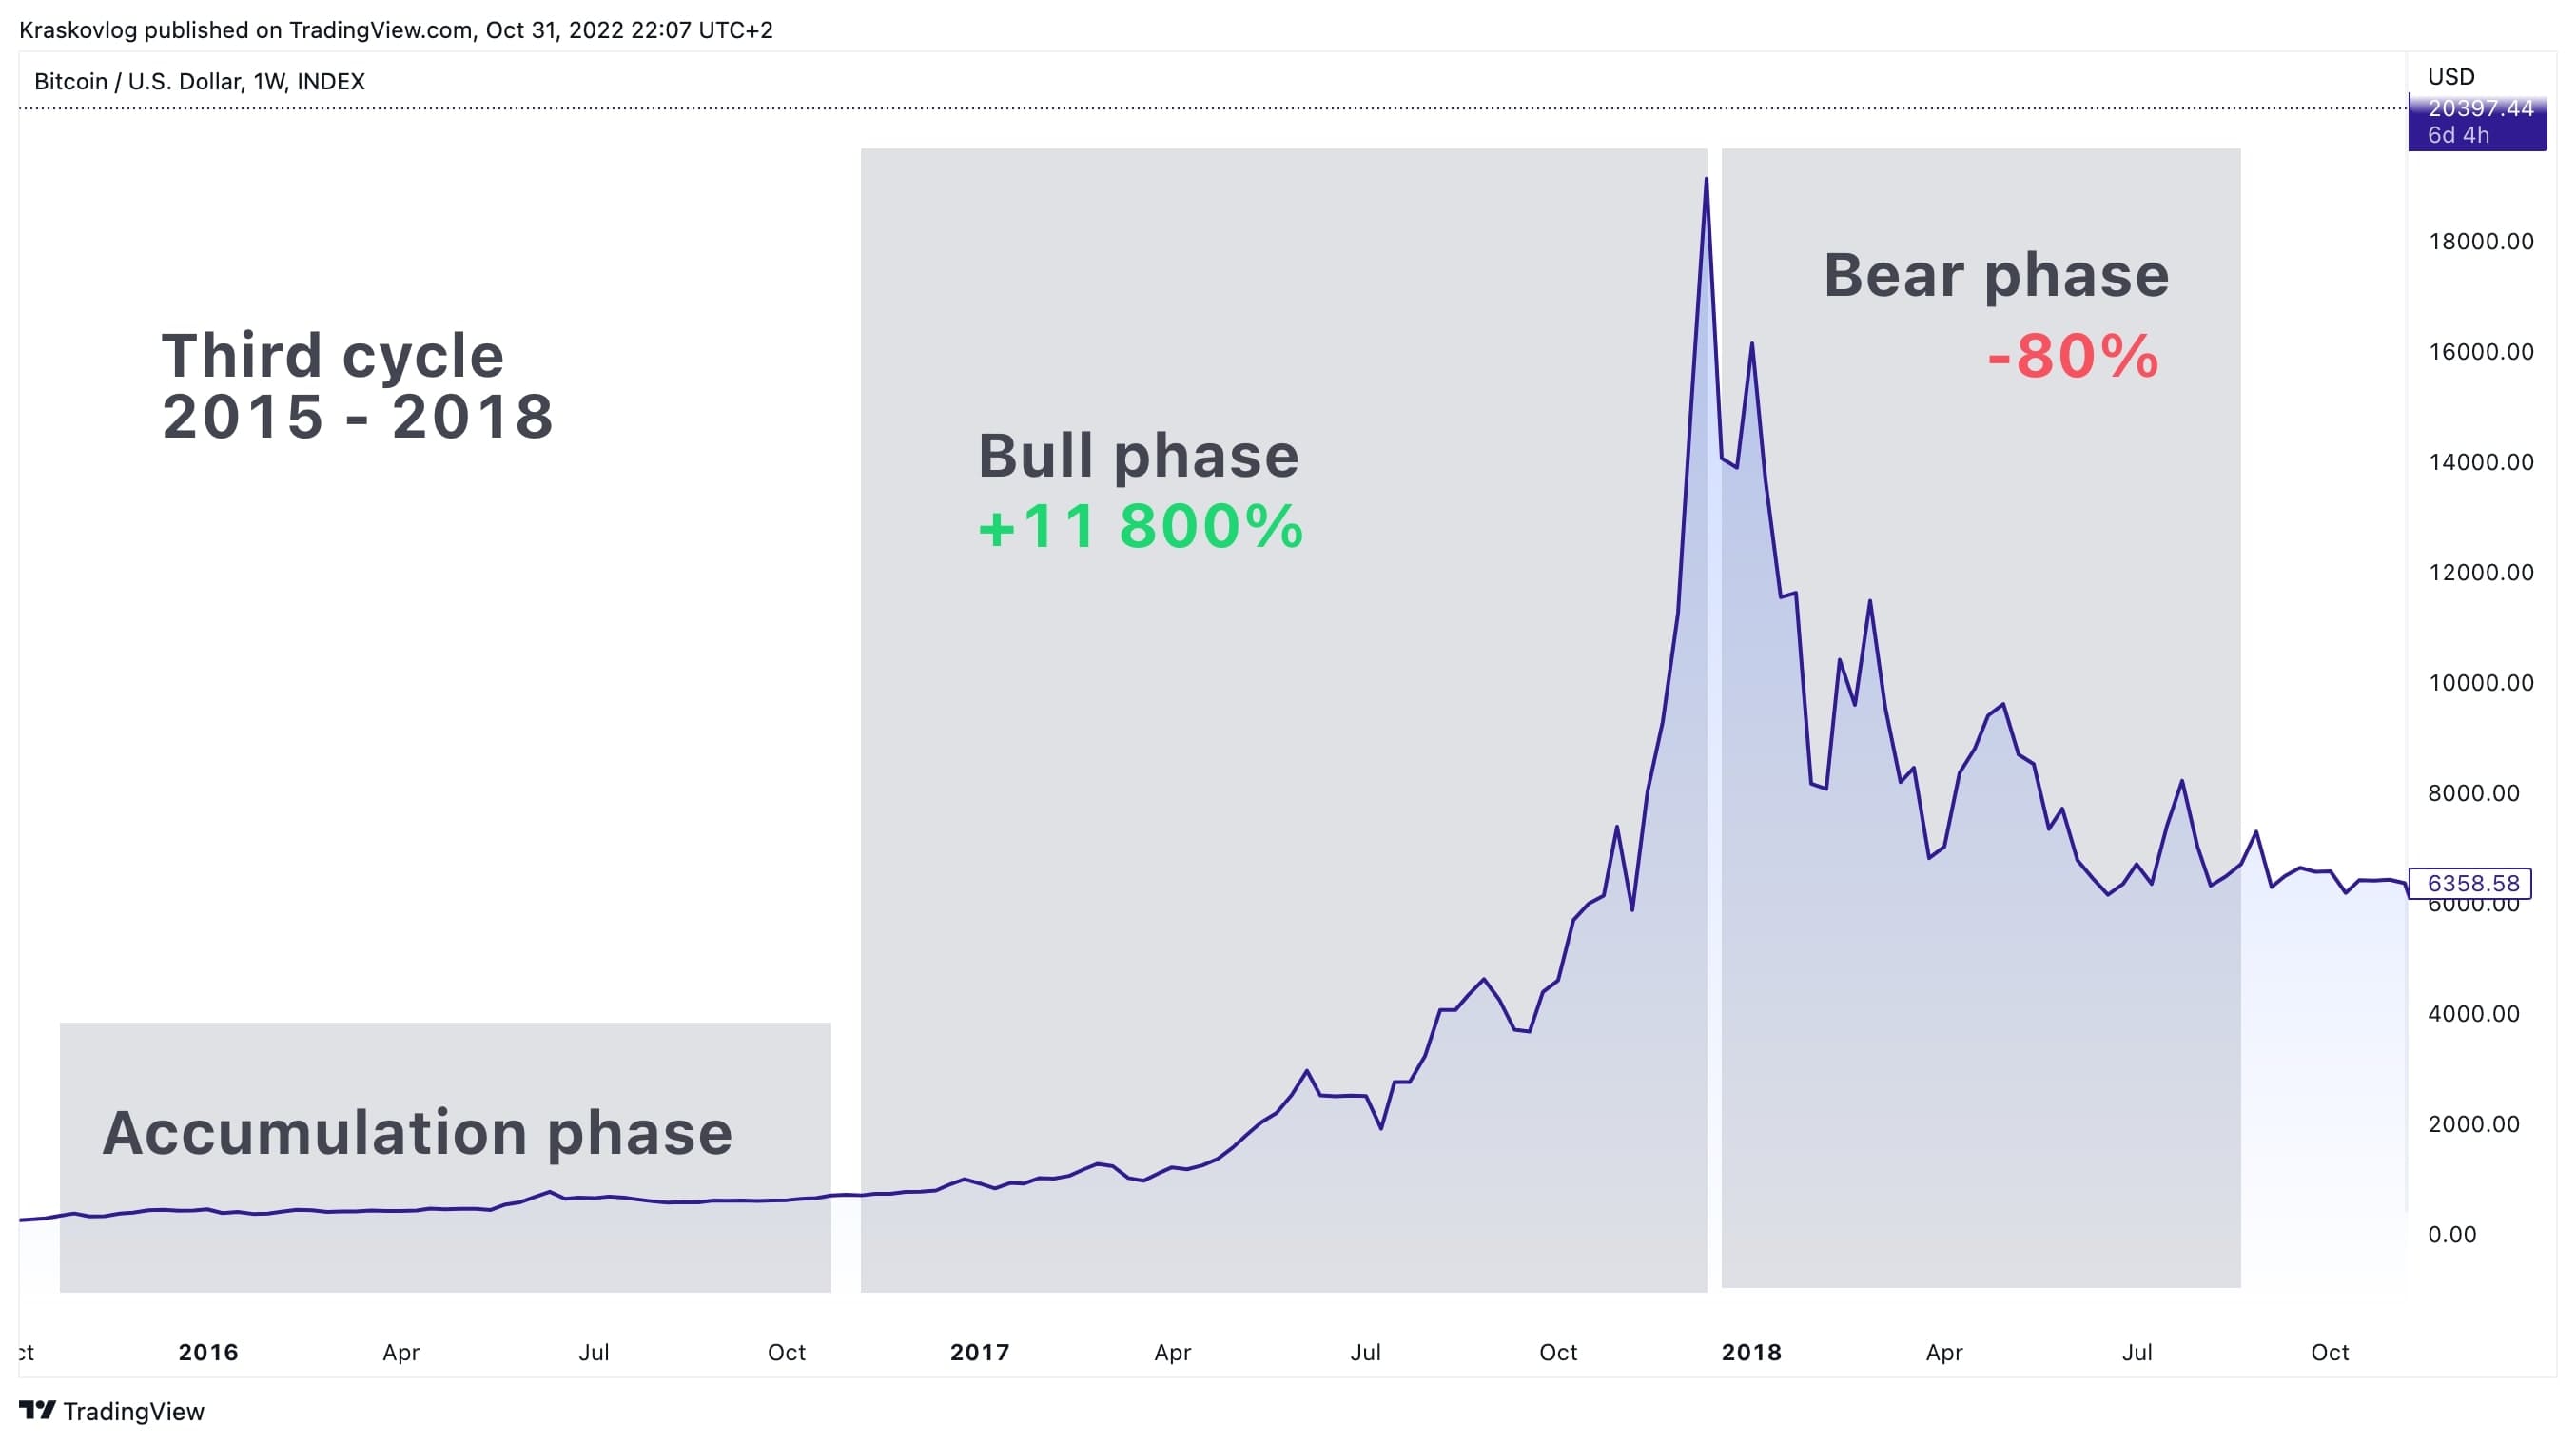
A new bear market and a new massive correction of 86% - BTC fell from $1,240 to $167. From January 2015 to December 2017, the bull market raised the price to $19,800, an increase of 11,800%.
Fourth Bitcoin Cycle
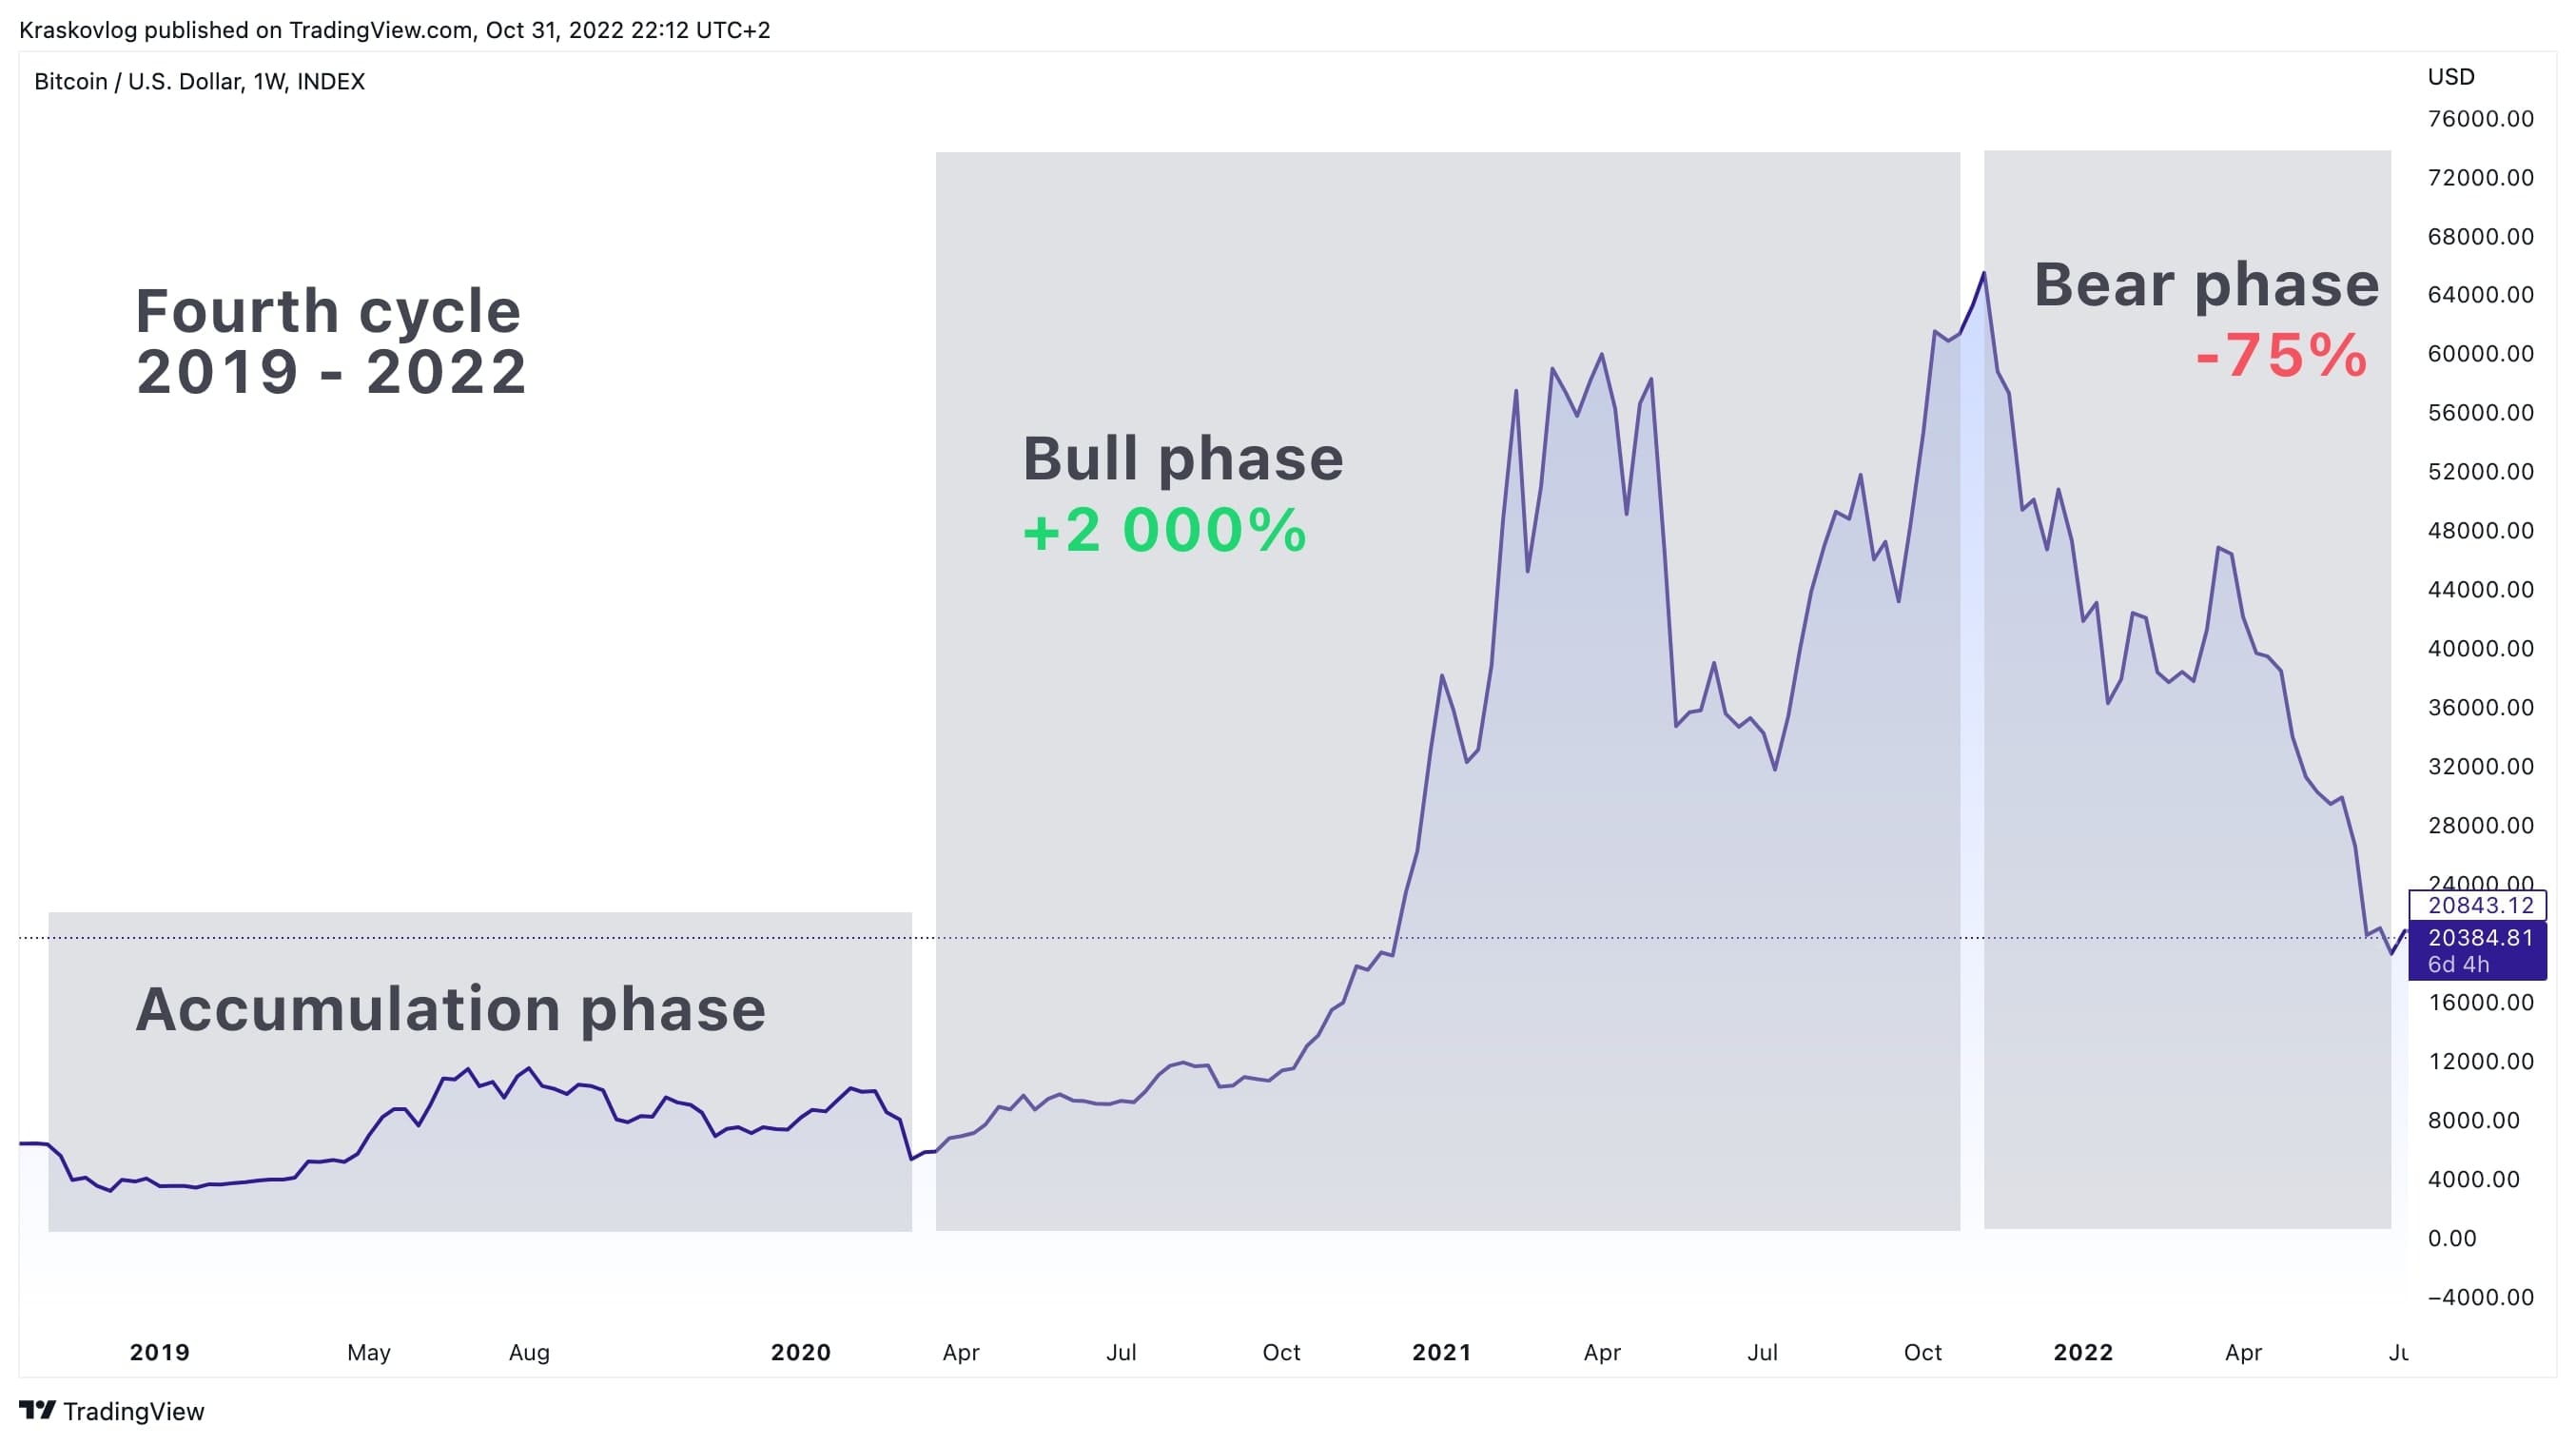
The BTC market experienced a correction again, this time of 84%. From December 2018 to November 2021, a new bull trend raised BTC to $69,000 from $3,123, an increase of 2,108%.
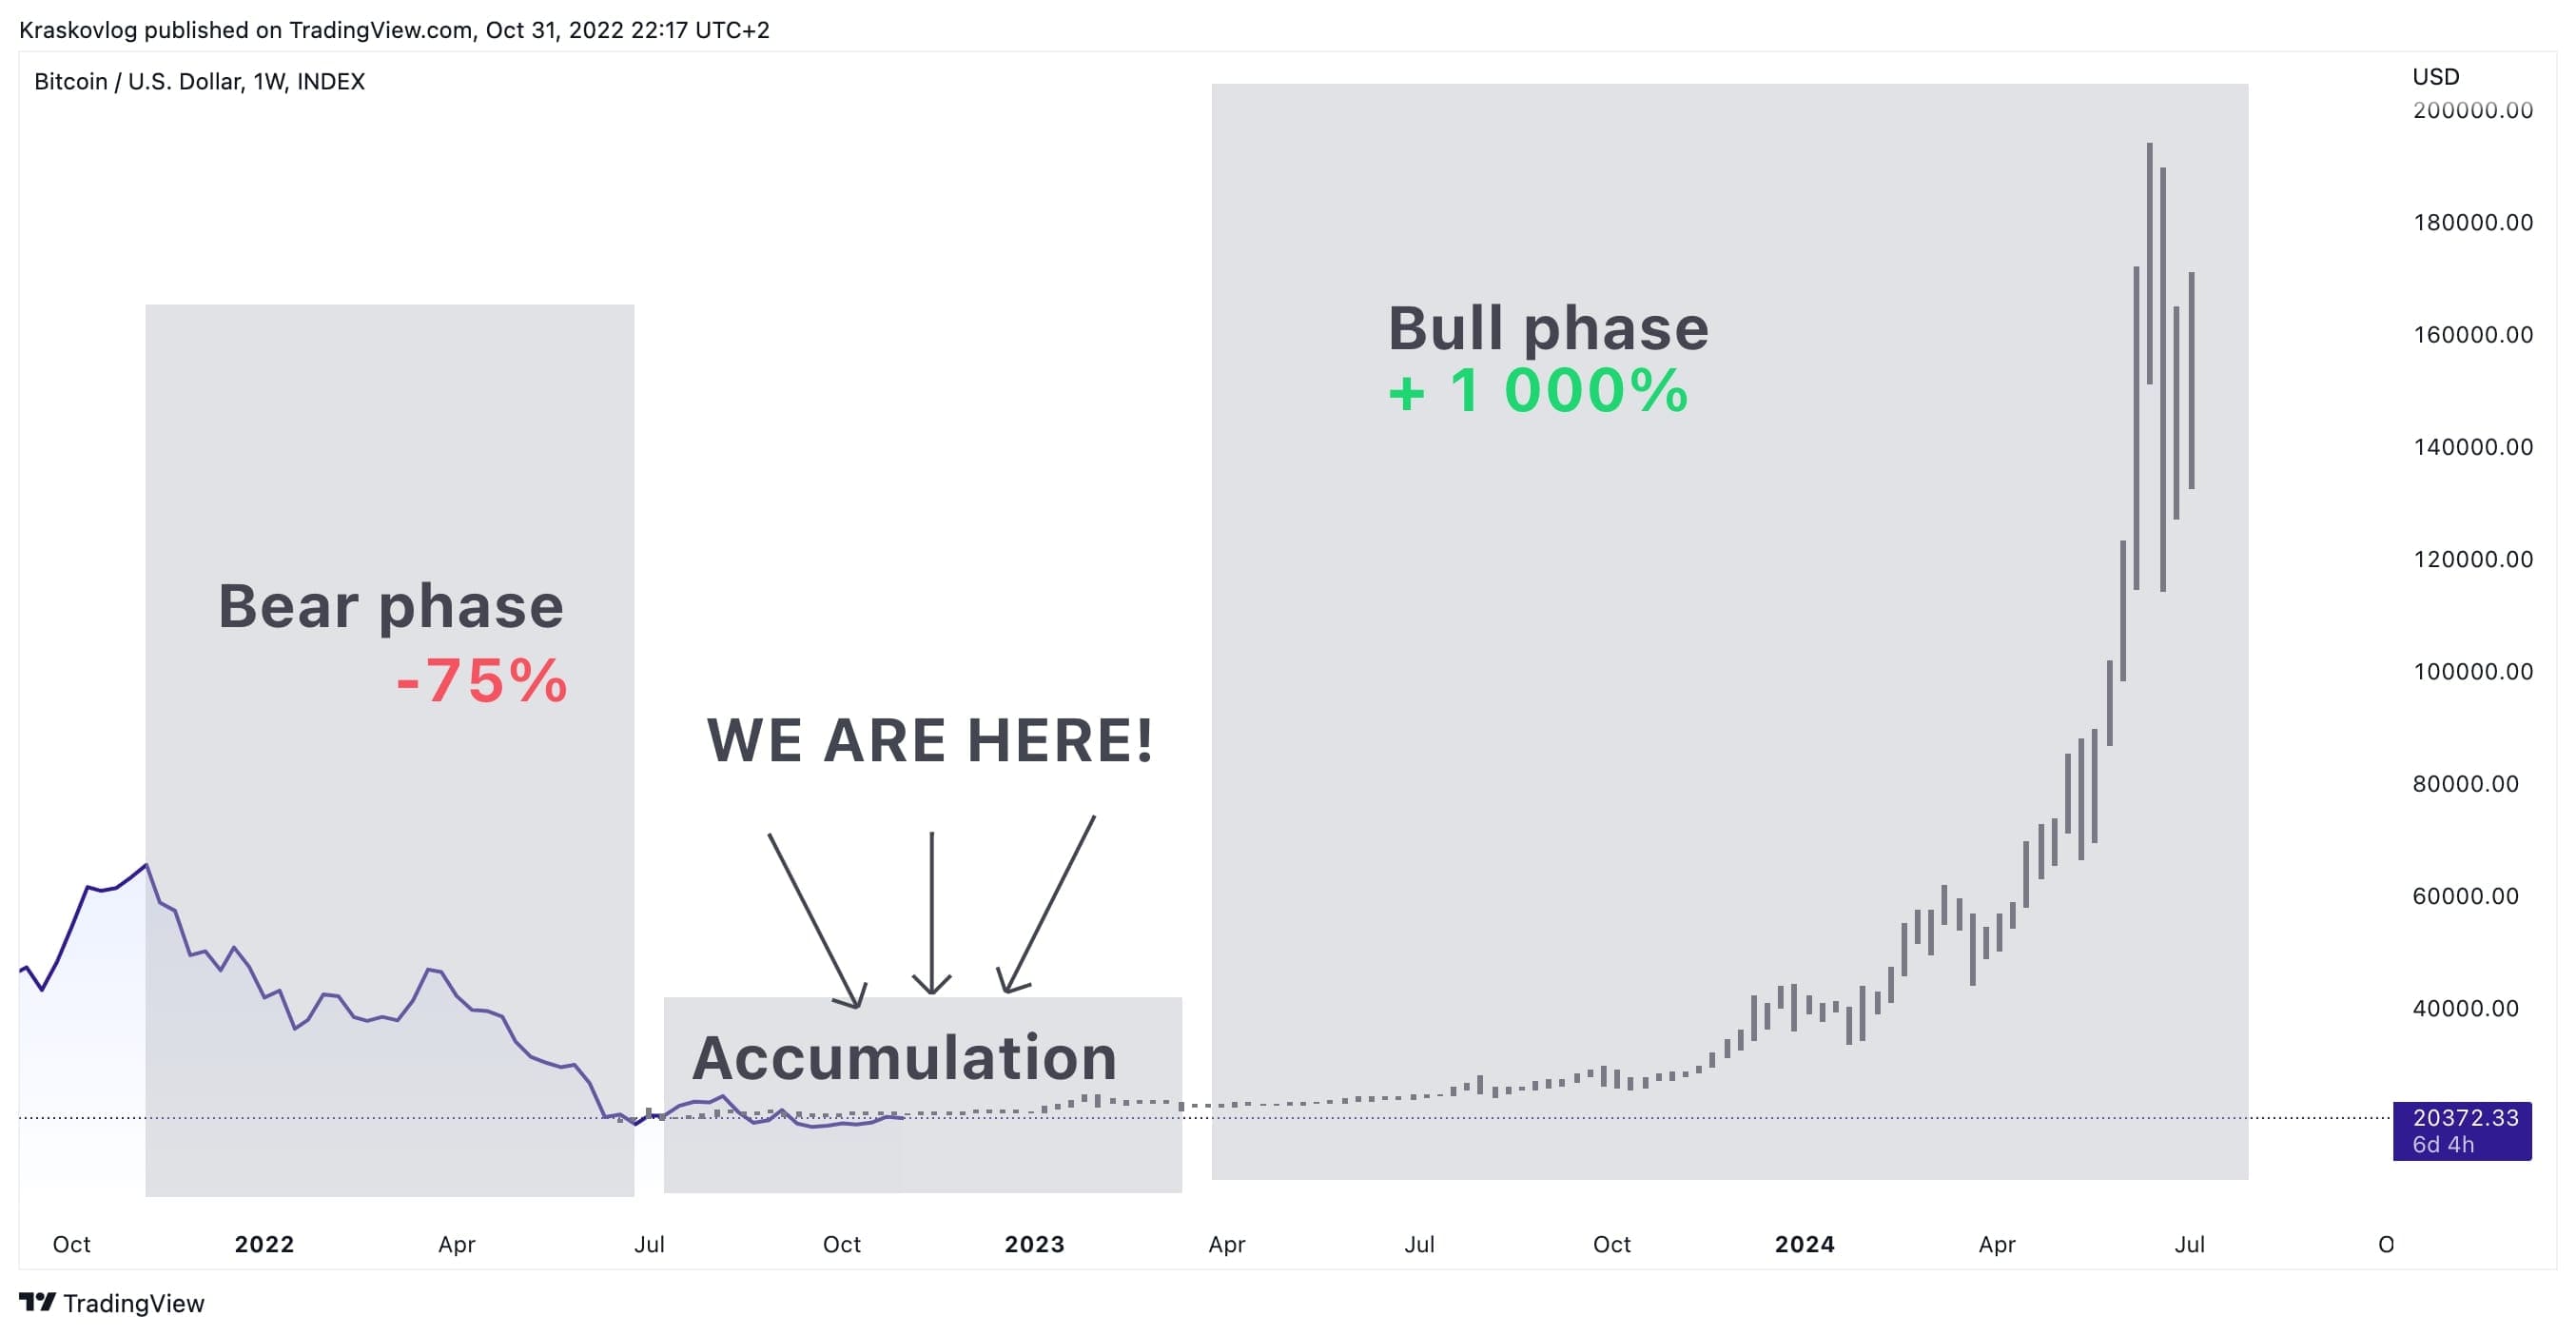
Fifth Bitcoin Cycle
We are here. At the moment, as the price ranges between $18k - $25k, these are the initial phases of the Bitcoin cycle. The bull trend phase will begin soon, eagerly awaited by every crypto enthusiast.
Indicator for Determining Cryptocurrency Market Cycles: When to Buy and Sell Cryptocurrency
In previous parts of our article, we revealed a secret that remains unknown to 95% of the market participants: the cryptocurrency market, particularly Bitcoin's price, moves in cycles. We didn't just discuss the fact of cyclicality; we provided a deep understanding of how and why this happens - a crucial foundation for successful trading.
However, a new challenge now arises: how to independently determine cryptocurrency market cycles? When is the perfect moment to buy cryptocurrency, and when is it worthwhile to sell and take profits?
We recommend our proprietary development, the Free version of the Greenwich indicator.

This indicator helps identify places where cryptocurrency is undervalued and worth investing in, as well as places where it is overvalued and worth taking profit.
Fill out the form to get this indicator for free.