Unlock the secrets of crypto trading with these top TradingView indicators!
By Yaroslav Krasko Updated February 29, 2024
BikoTrading Academy
Crypto trading can be a highly rewarding venture, but it requires skill and knowledge to be successful. In order to make informed trading decisions, it's important to have access to the right tools and resources. One such tool is TradingView, a popular platform among traders that offers a wide range of technical analysis tools and indicators.
KEY ISSUES:
Top 3 technical indicators for trading cryptocurrency on TradingView
In this article, we'll explore the top 3 TradingView indicators for crypto trading that can help unlock the secrets to successful trading. Whether you're a beginner or an experienced trader, these indicators can help you make more informed trading decisions and increase your chances of success in the crypto market.
Relative Strength Index (RSI)
Are you ready to add a powerful tool to your cryptocurrency trading arsenal? Look no further than the Relative Strength Index (RSI). This popular indicator is a must-have for any trader looking to make informed decisions in the world of crypto.
So, what is RSI? Simply put, it's a scale that measures the strength of a cryptocurrency's price. It ranges from 0 to 100, with readings of 70 or higher indicating overbought conditions (dangerous for buying and a possible time to sell or open a short position), and readings of 30 or lower indicating oversold conditions (a good time to buy). By analyzing RSI, traders can gain insights into whether an asset is undervalued or overvalued, enabling them to make more informed trading decisions.
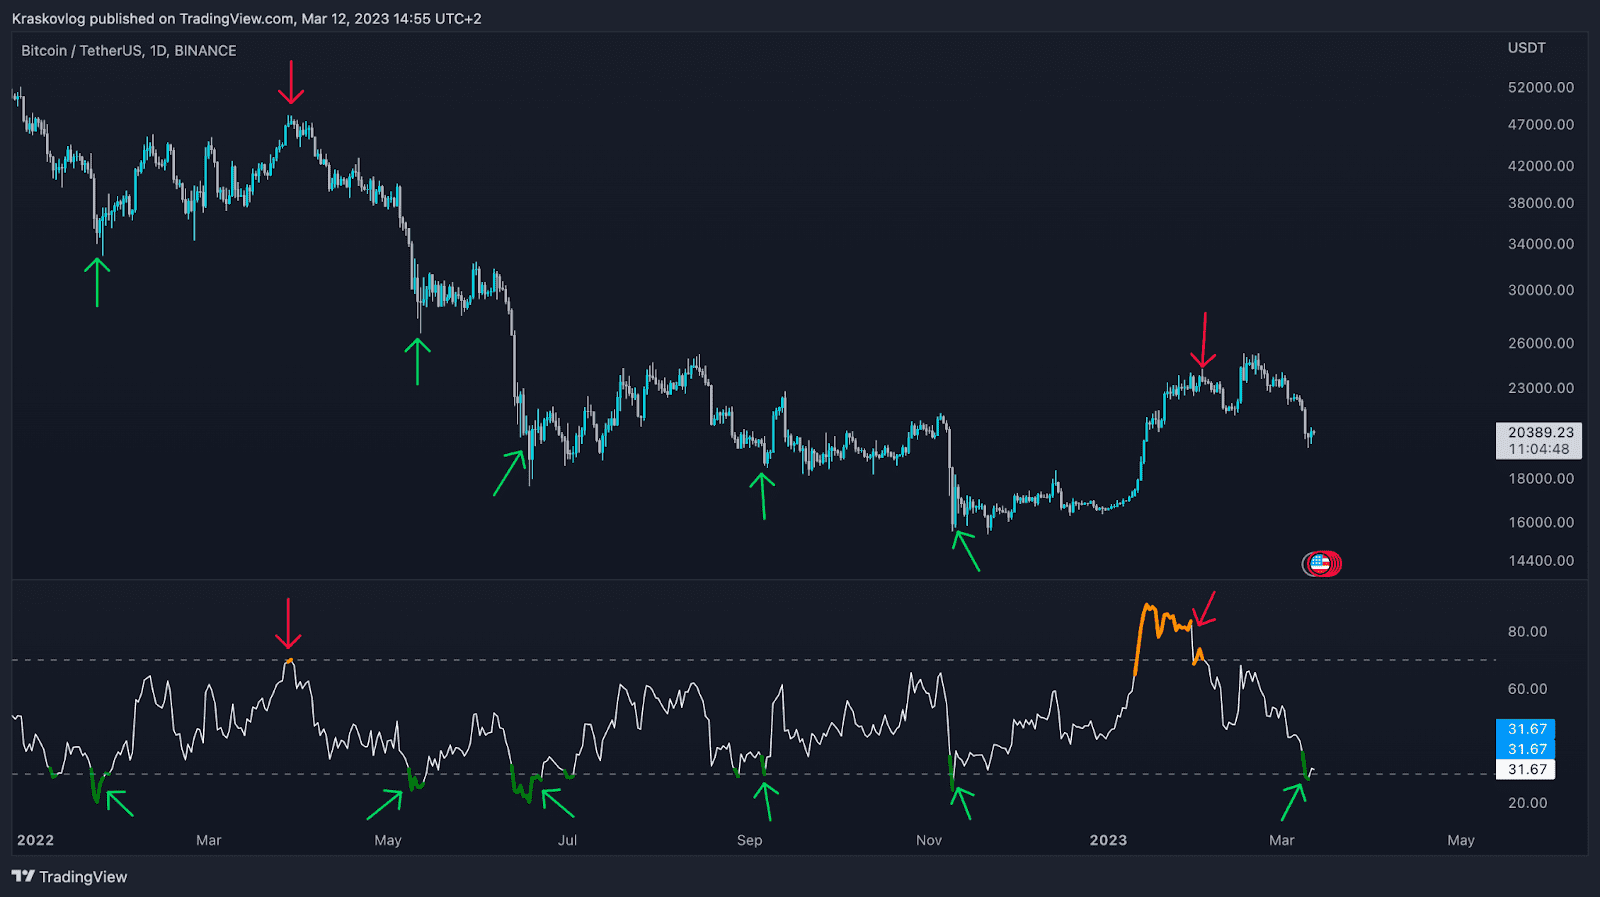
And how do you use RSI for cryptocurrency trading? One popular strategy involves looking for divergences between RSI and the price of the asset. For example, if the price of a cryptocurrency is forming new highs but the RSI is indicating a decrease, this may indicate negative divergence and a potential trend reversal. Conversely, if the price is forming new lows but the RSI is indicating an increase, this may indicate positive divergence and a potential trend reversal.
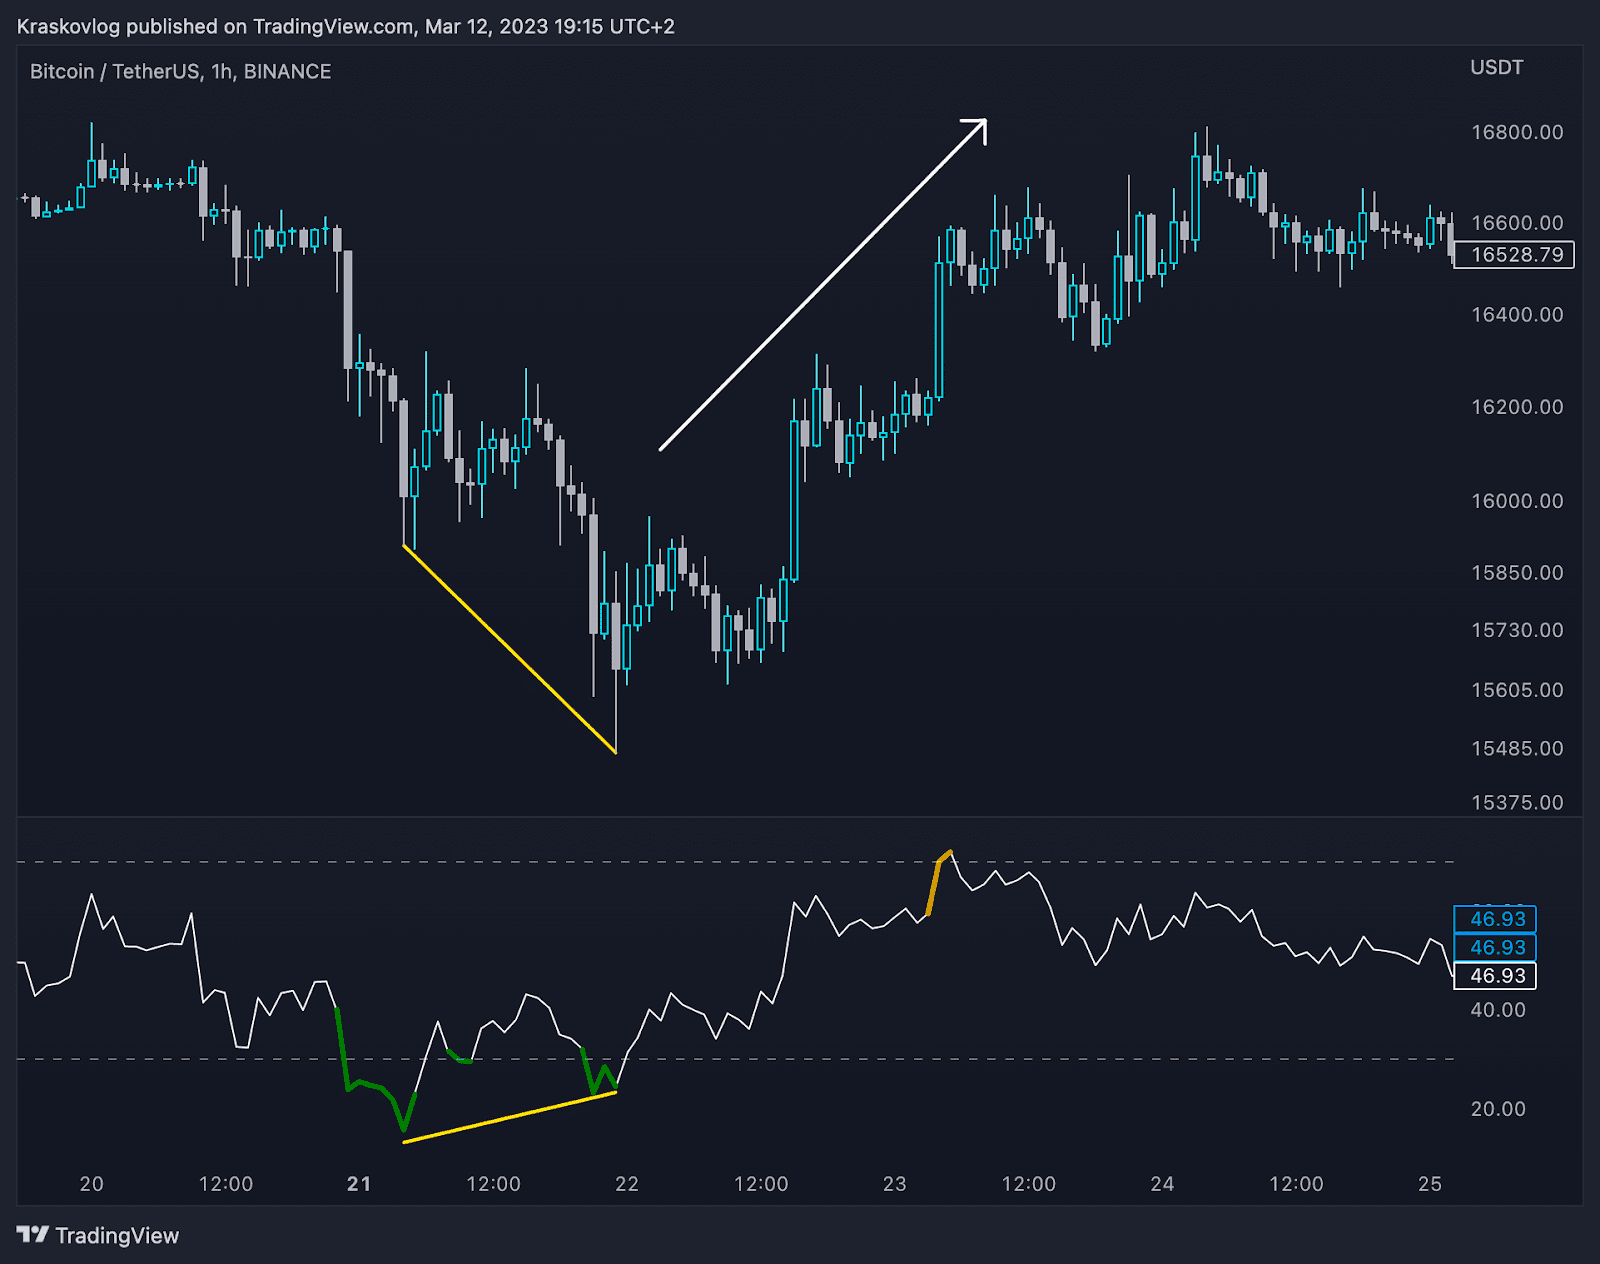
With its versatility and ease of use, the Relative Strength Index (RSI) is a must-have tool for any trader looking to succeed in the fast-paced world of cryptocurrency trading. So what are you waiting for? Start incorporating RSI into your trading strategy today and unlock the potential for greater success in the market.
Recommendations from BikoTrading:
- Exiting the overbought zone (above 70) or oversold zone (below 30) is not necessarily a signal to buy or sell, as the price can stay above or below these marks for a while. It is better to wait for a reversal back above the 30 level or below the 70 level before making trading decisions.
- The win rate will not be 100%, but the signal accuracy is quite high, so consider this in your risk management system and don't risk more than 1-2% of your deposit.
- Learn how to identify divergences, as this can increase the accuracy of your trading.
- The higher the timeframe, the more accurate the signals.
- RSI is not a panacea, it can be a good tool to confirm your analysis or trading decisions, keep this in mind.
- Try combining different indicators, as this can increase your win rate.
- If you are a beginner with less than 3 years of experience and no trading strategies, try starting with ready-made Buy/Sell indicators and learning and developing in this field in parallel.
Moving Average Convergence Divergence (MACD)
Are you ready to take your cryptocurrency trading to the next level? Then the Moving Average Convergence Divergence (MACD) indicator is exactly what you need. This powerful tool can help you stay ahead of the game and make informed trading decisions in the fast-paced world of cryptocurrency.
So, what exactly is the MACD? Simply put, it is an oscillator that measures the difference between two moving average lines. It consists of two lines that oscillate around each other and a histogram that shows the strength of the price. By analyzing the MACD lines and histogram, traders can get an idea of the strength and direction of the cryptocurrency trend.
But how can you use the MACD for cryptocurrency trading? One popular strategy is to track the crosses of the MACD lines. For example, if the MACD line crosses the signal line from below to above, it may indicate a bullish trend and buyer strength, while a cross from above to below may indicate a bearish trend and seller strength.
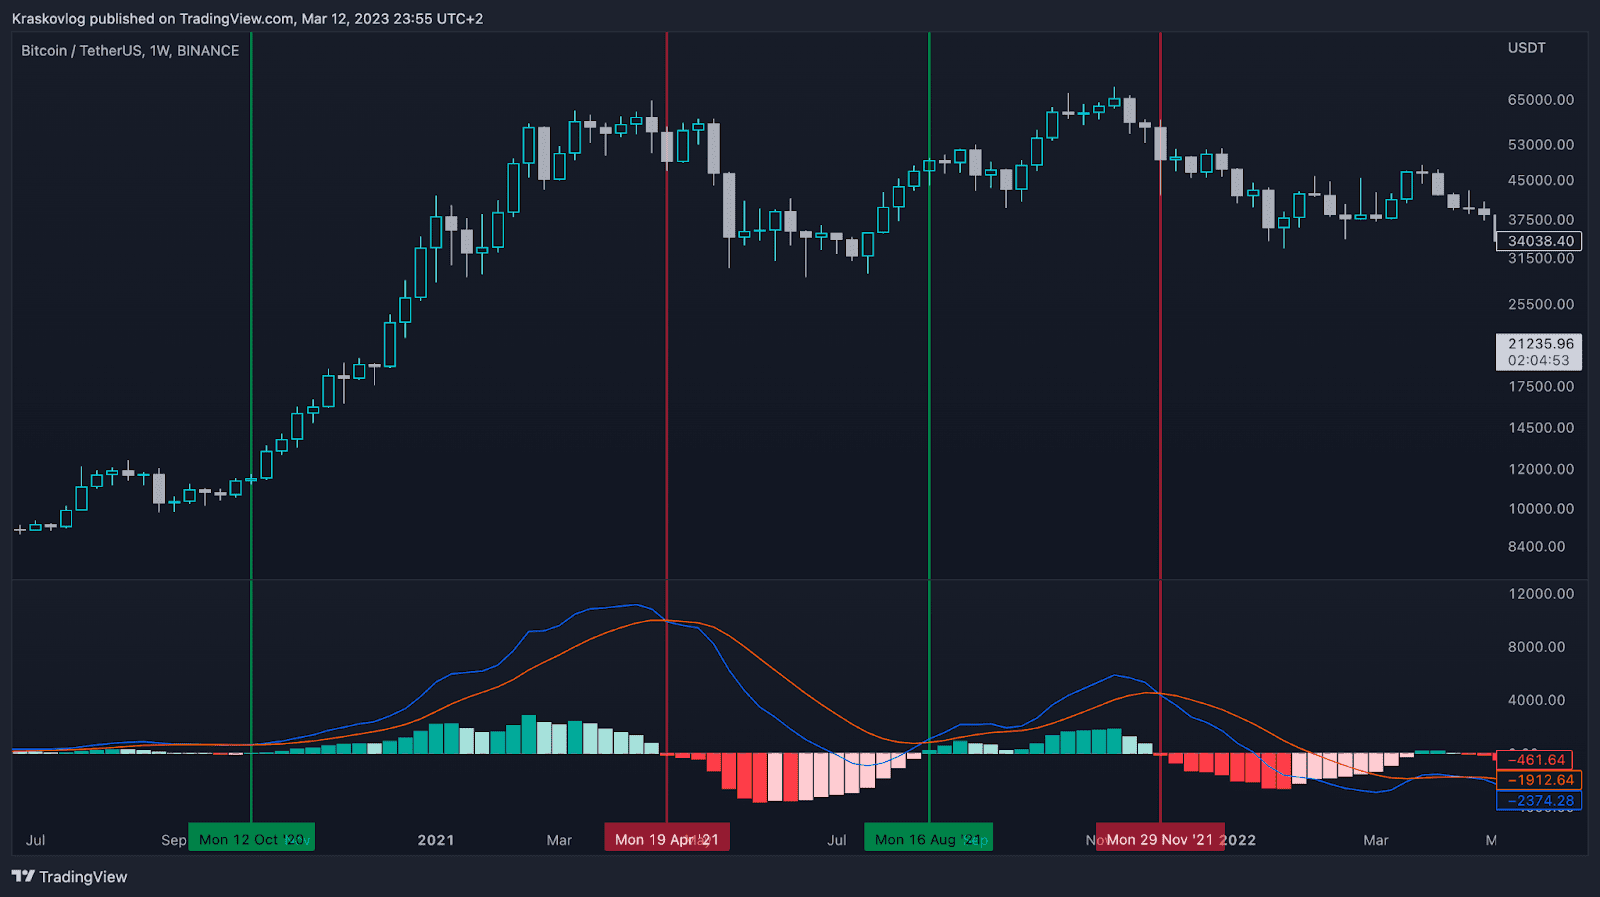
Traders can also use the MACD histogram to determine the strength of buyers/sellers and predict a trend reversal in advance.
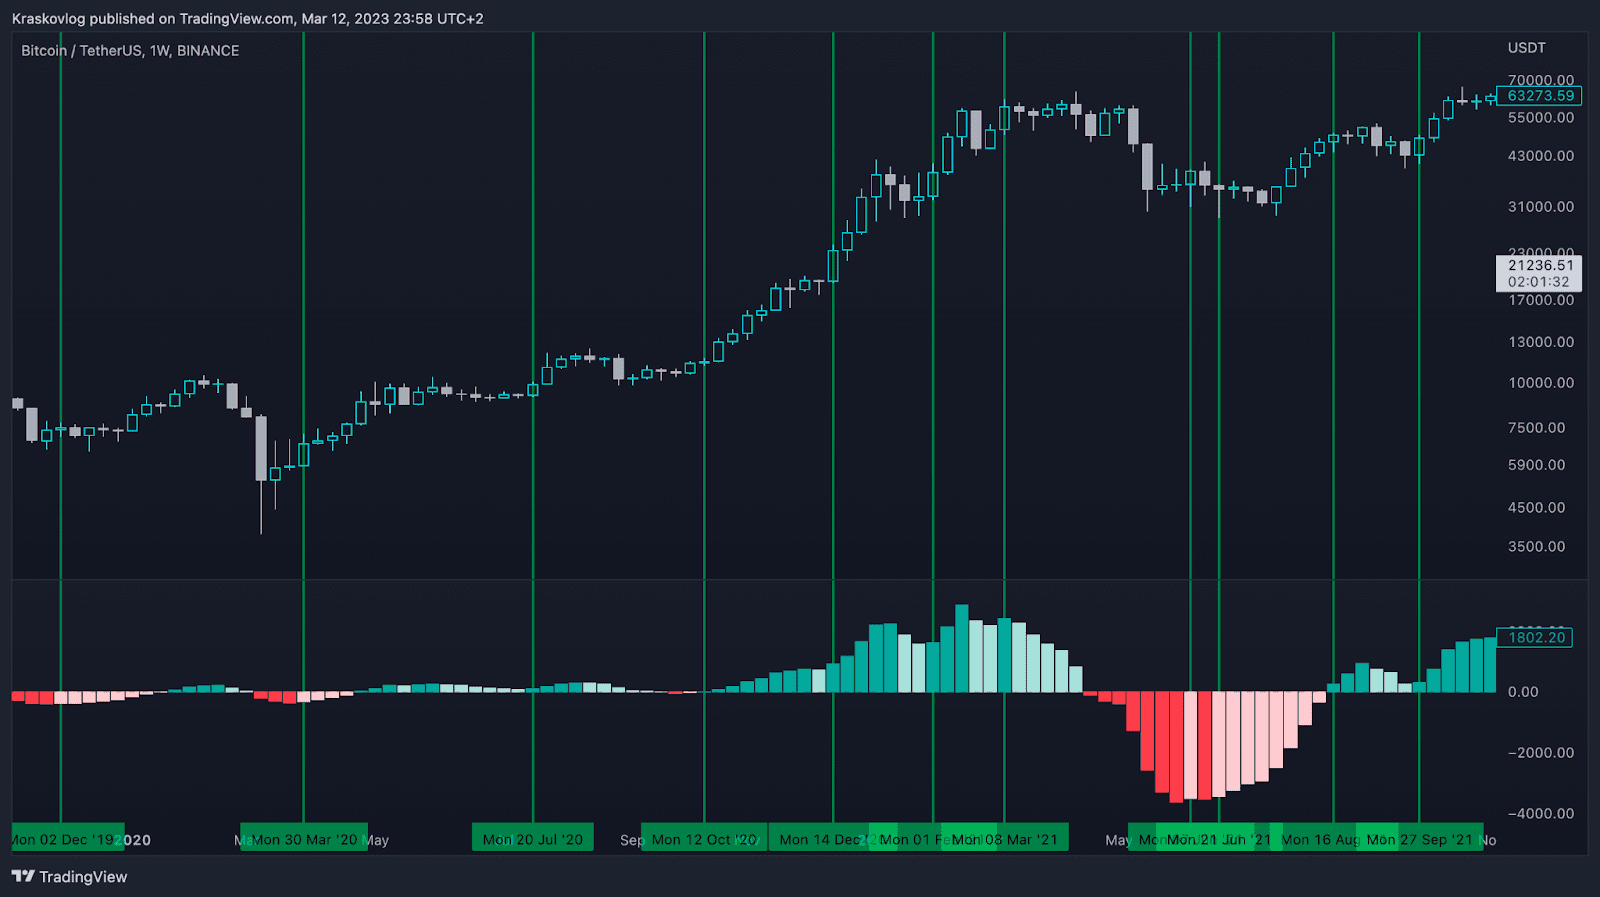
Strong green columns indicate the strength of buyers, while light red columns suggest a potential price reversal in the future.
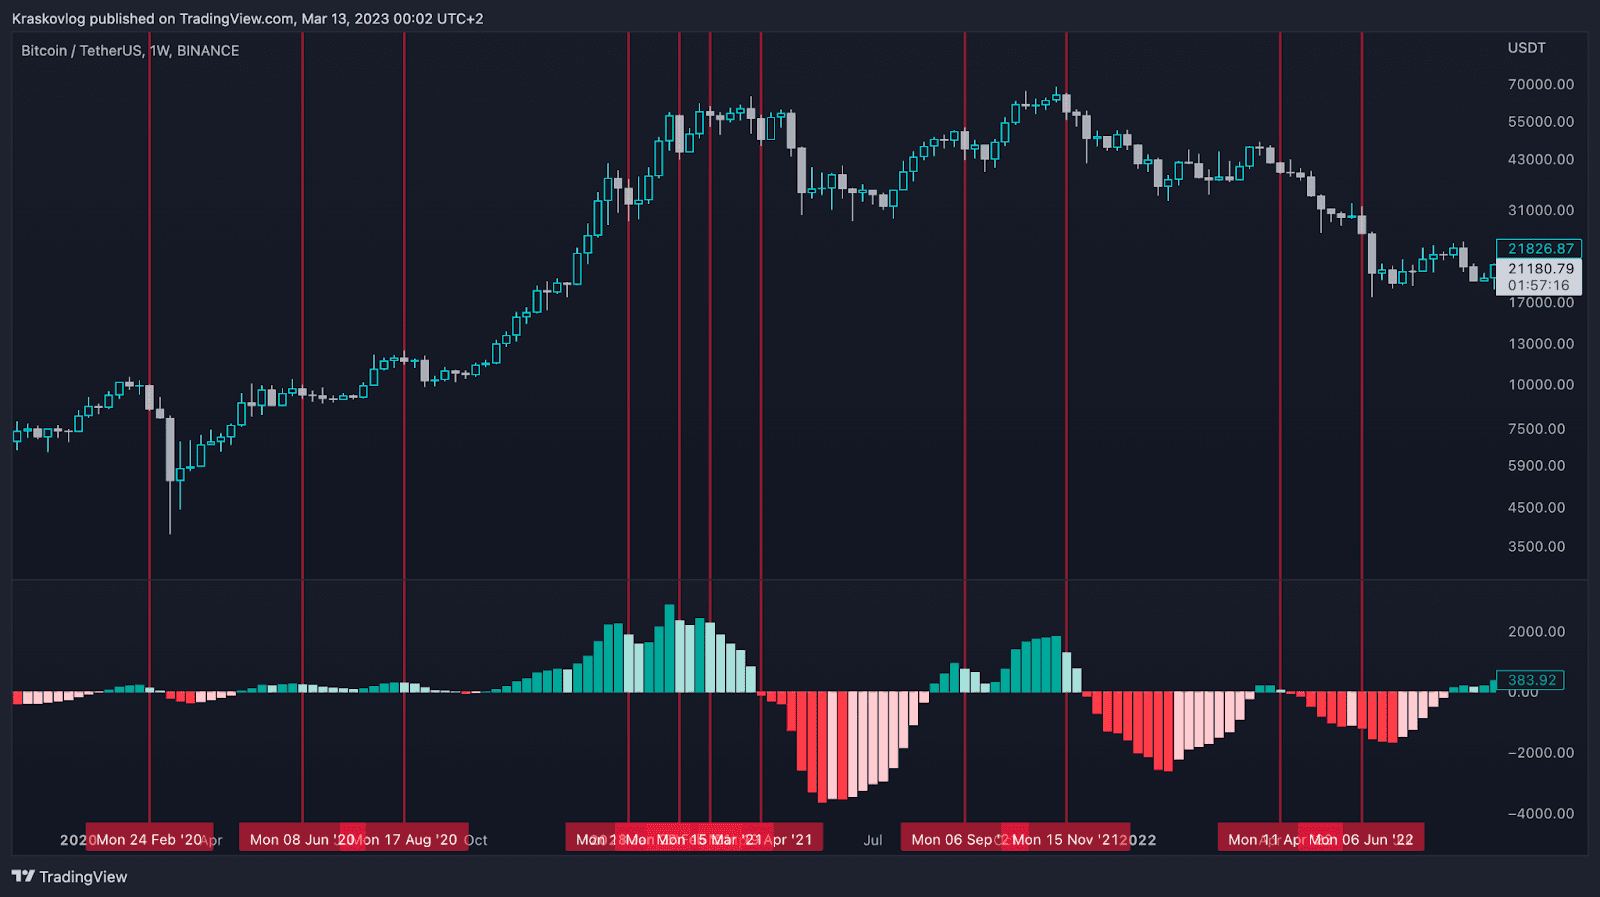
Strongly pronounced red bars indicate the strength of sellers, while light green bars indicate a possible price reversal in the future.
Thanks to its versatility and ability to detect trends and trend reversals, the MACD indicator is an indispensable tool for any cryptocurrency trader.
Recommendations from BikoTrading:
- Note that the percentage of signal accuracy is not 100%, it is very important to be able to determine the overall price trend. If the trend is bullish, it is advisable to avoid sell signals and follow buy signals and vice versa.
- According to the previous recommendation, we suggest understanding the cycles of the cryptocurrency market and Bitcoin, which will allow you to understand in which phase the market is and when it is best to follow a signal or avoid it.
- Try changing the indicator settings and adjusting them to the cryptocurrency you are trading, this can increase the accuracy of your signals.
Bollinger Bands
Want to gain an edge over other traders in the cryptocurrency market? Then you need the Bollinger Bands indicator - a versatile tool that can help you understand where the cryptocurrency price is heading and where to look for buying or selling opportunities.
So what is this indicator? Bollinger Bands is a set of three lines displayed on the price chart. The middle line is the simple moving average (usually 20 periods), and the upper and lower lines are a certain number of standard deviations away from the middle line. We have found that setting the period to 80 can provide clearer signals for buying or selling. By analyzing the distance between these lines, traders can get information about possible price fluctuations and its volatility.
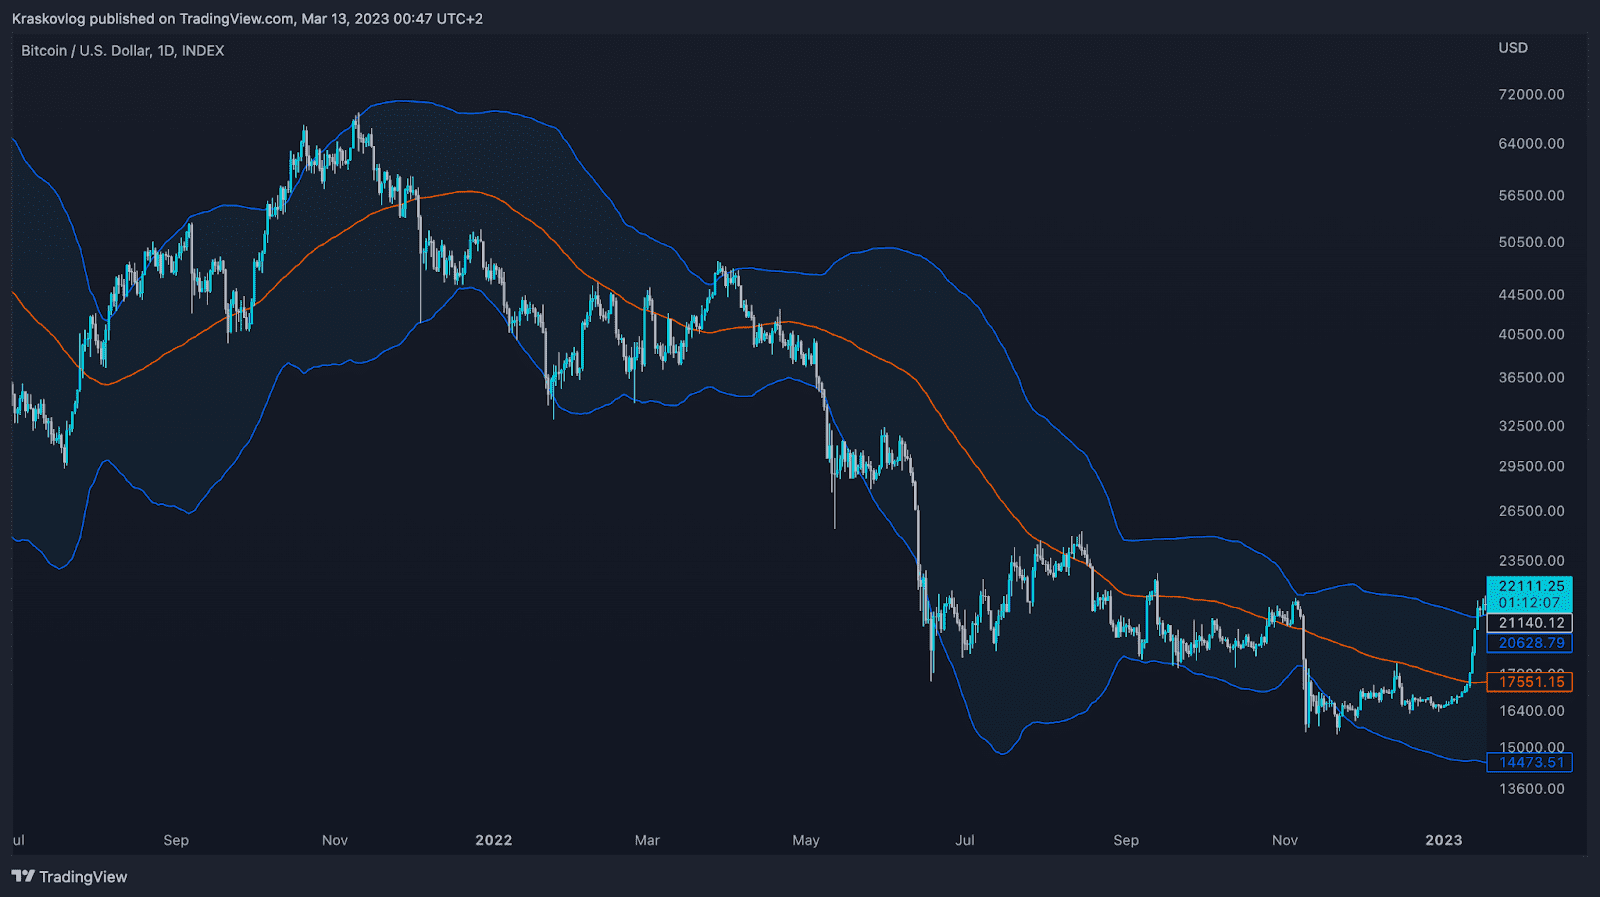
But that's not all - Bollinger Bands can also help determine if a cryptocurrency price is overbought or oversold in the market. If the price is approaching the upper band, a price correction may be expected, and when the price is approaching the lower band, a price increase may be expected.
+1 Extra Indicator for Determining Cryptocurrency Market Cycles: When to Buy and Sell Cryptocurrency
The free Greenwich system is designed solely for spot trading and includes analysis of volumes, market liquidity, global support and resistance zones, liquidation level measurements, and market cyclicality models.
Combined, these elements create a comprehensive investment system, which to this point in Bitcoin's history has never been incorrect in its calculations and has perfectly identified the best times to invest in cryptocurrency and the optimal moments to take profit.
We recommend our proprietary development, the Free version of the Greenwich indicator.
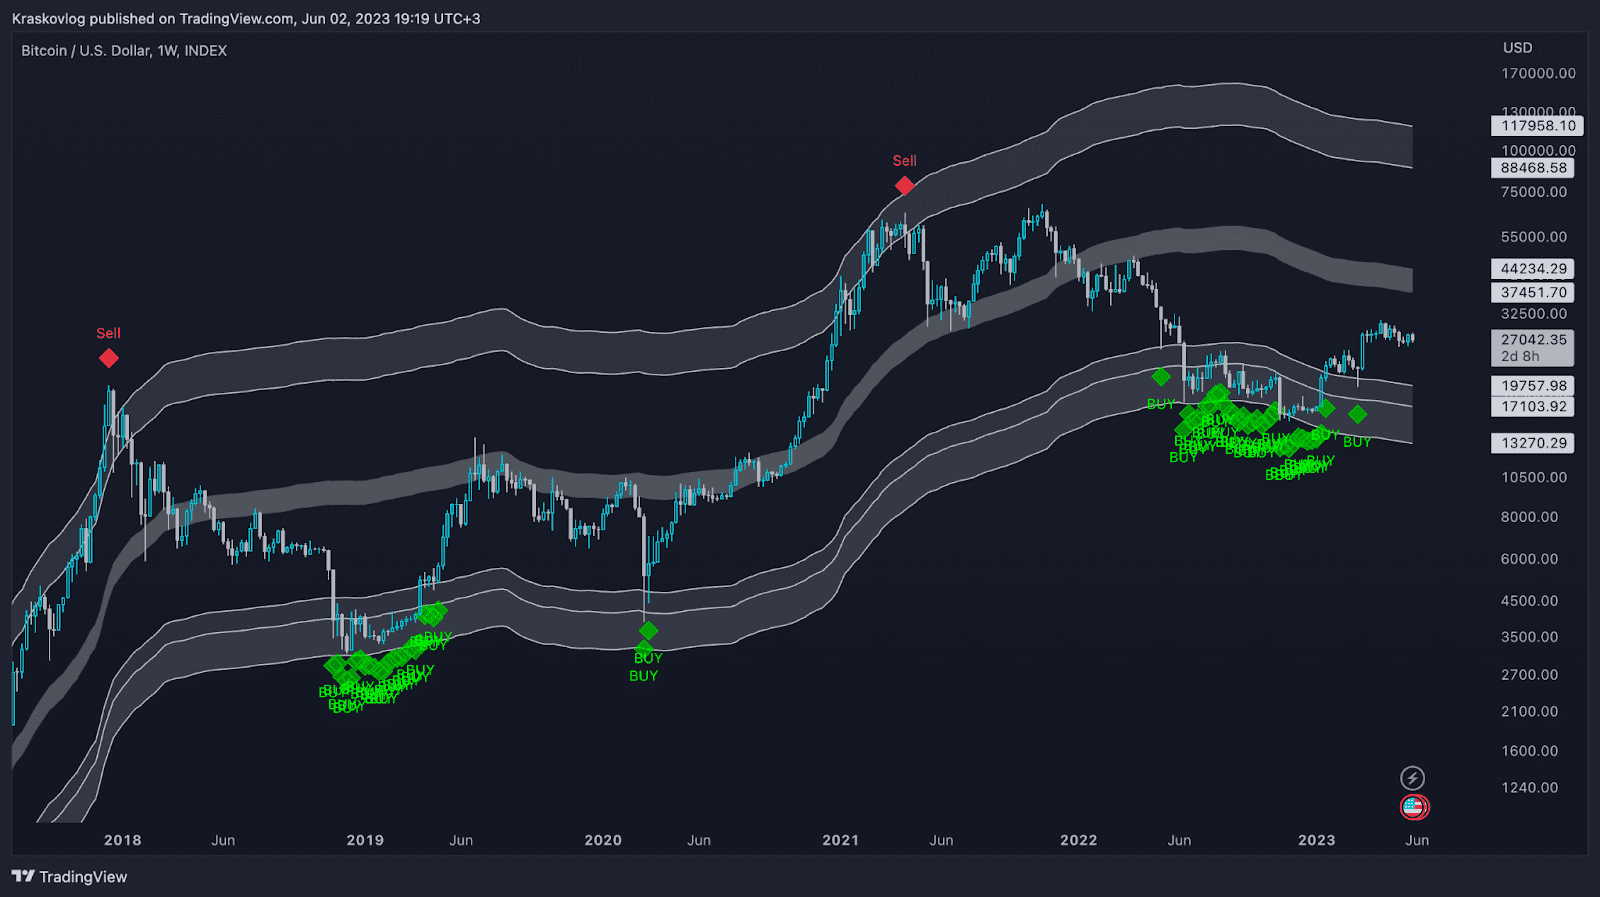
This indicator helps identify places where cryptocurrency is undervalued and worth investing in, as well as places where it is overvalued and worth taking profit.
Fill out the form to get this indicator for free.

