Trading strategy for Footprint with big volumes
By Yuriy Bishko Updated June 13, 2024
BikoTrading Academy
The market is driven by large volumes, and they have the greatest impact on asset price changes and movements. To determine these volumes, it’s necessary to have effective strategies and tools that allow traders to analyze charts. In this article, we will look at what footprint is, why it is important for market analysis, and how to use it in a trading strategy for Footprint with big volumes.
KEY ISSUES:
What is the footprint in trading?
Footprint displays information about traded volume and price in a user-friendly format. It is based on Order Flow data that shows the interaction between buyers and sellers in the market at any given time. The order flow footprint chart is the key to understanding market dynamics. Read more about footprint and how to use it in this article.
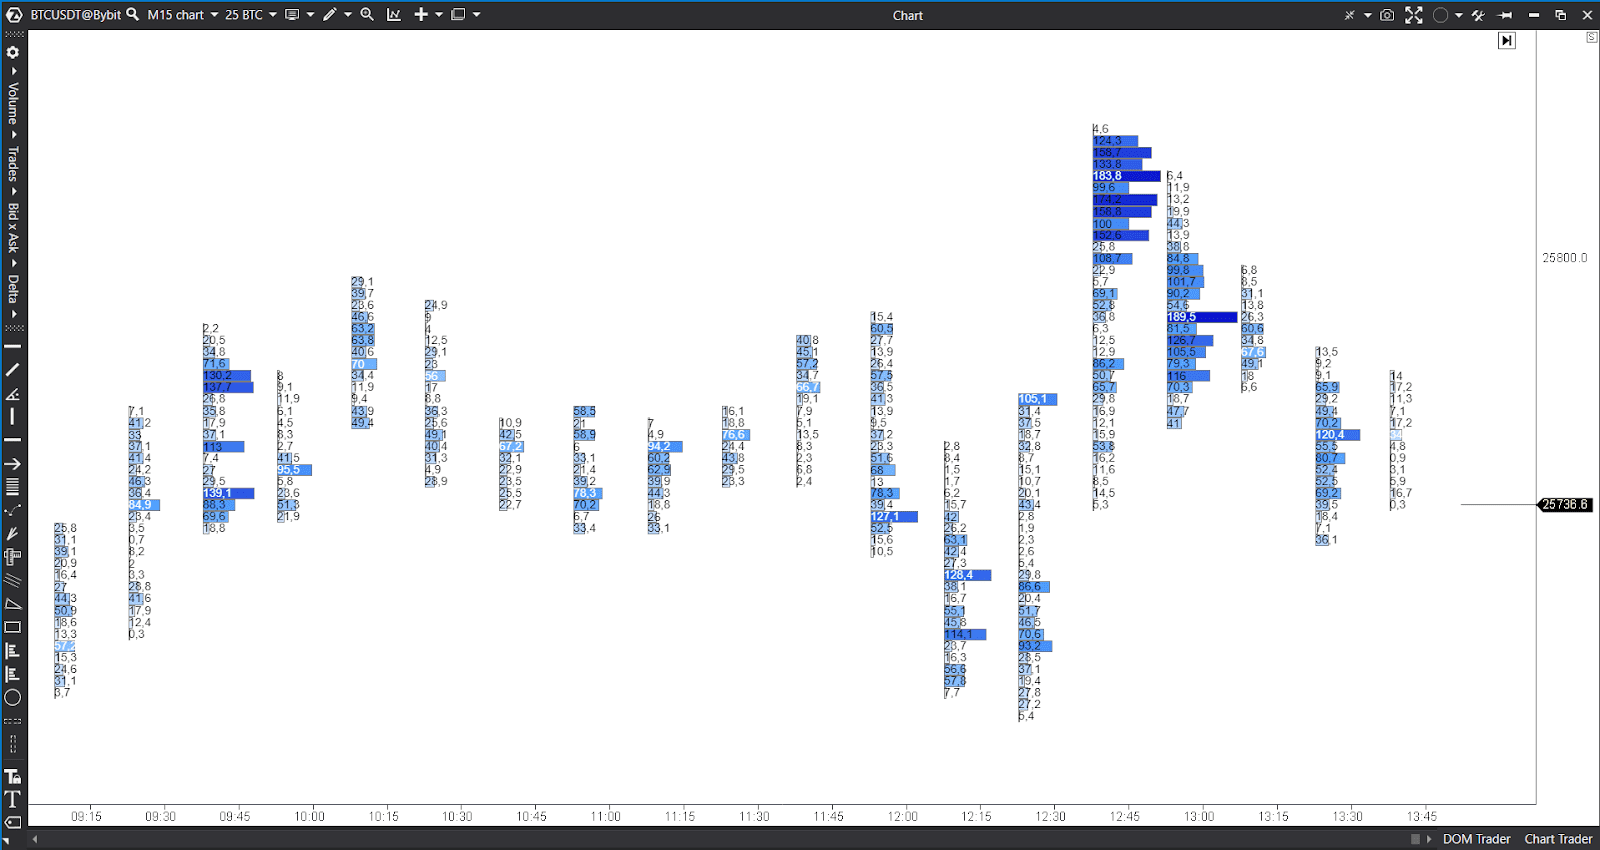
One of the key advantages of the Footprint is its ability to highlight cases when significant volumes of trades enter the market. A footprint image reveals the footprints of market activity, helping traders spot significant volume levels. Large volumes often act as powerful support or resistance levels. This means that when the price approaches these levels, traders can expect significant price movements.
Learn the trading strategy for Footprint with big volumes in the video
Step 1. Filtering out large volumes on the market
The main point of this strategy is to detect large volumes on the Footprint chart. Such situations often mean increased market activity.
- Set a threshold that defines the abnormal volume. This threshold should be relative to the average volume for a certain period, for example, the last hour or day.
- Pay attention to certain candlestick patterns on the footprint charts. Large bullish or bearish candles accompanied by large volumes can indicate significant changes in market sentiment.
- Compare situations with high volumes with price movements. A sharp increase in buying volume that leads to a price increase may indicate strong bullish sentiment, while a sharp increase in selling volume that leads to a price drop may signal bearish sentiment.
Step 2. Determine support and resistance levels
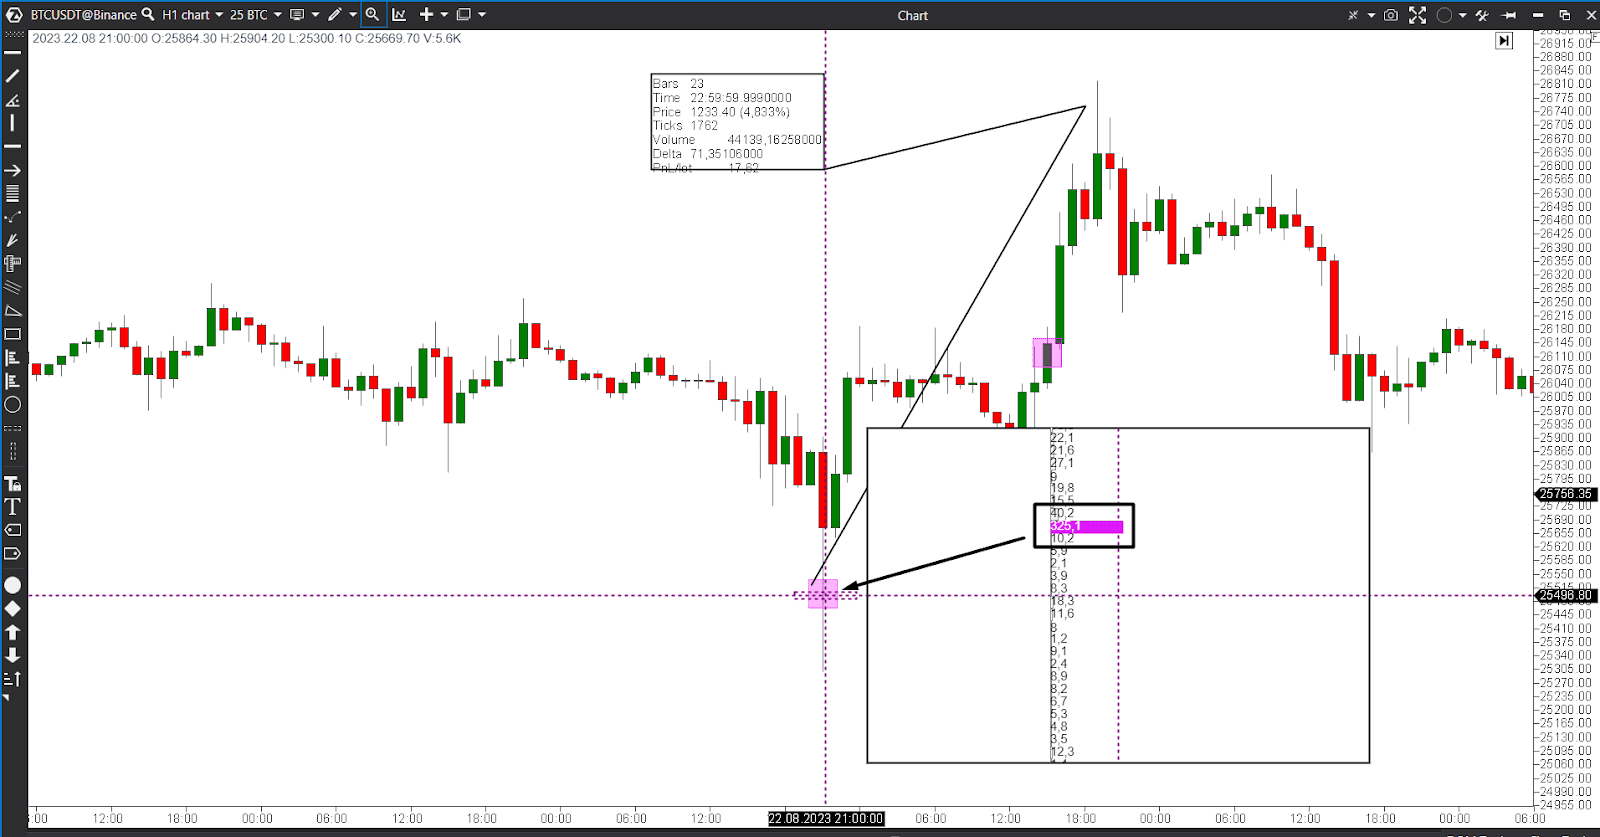
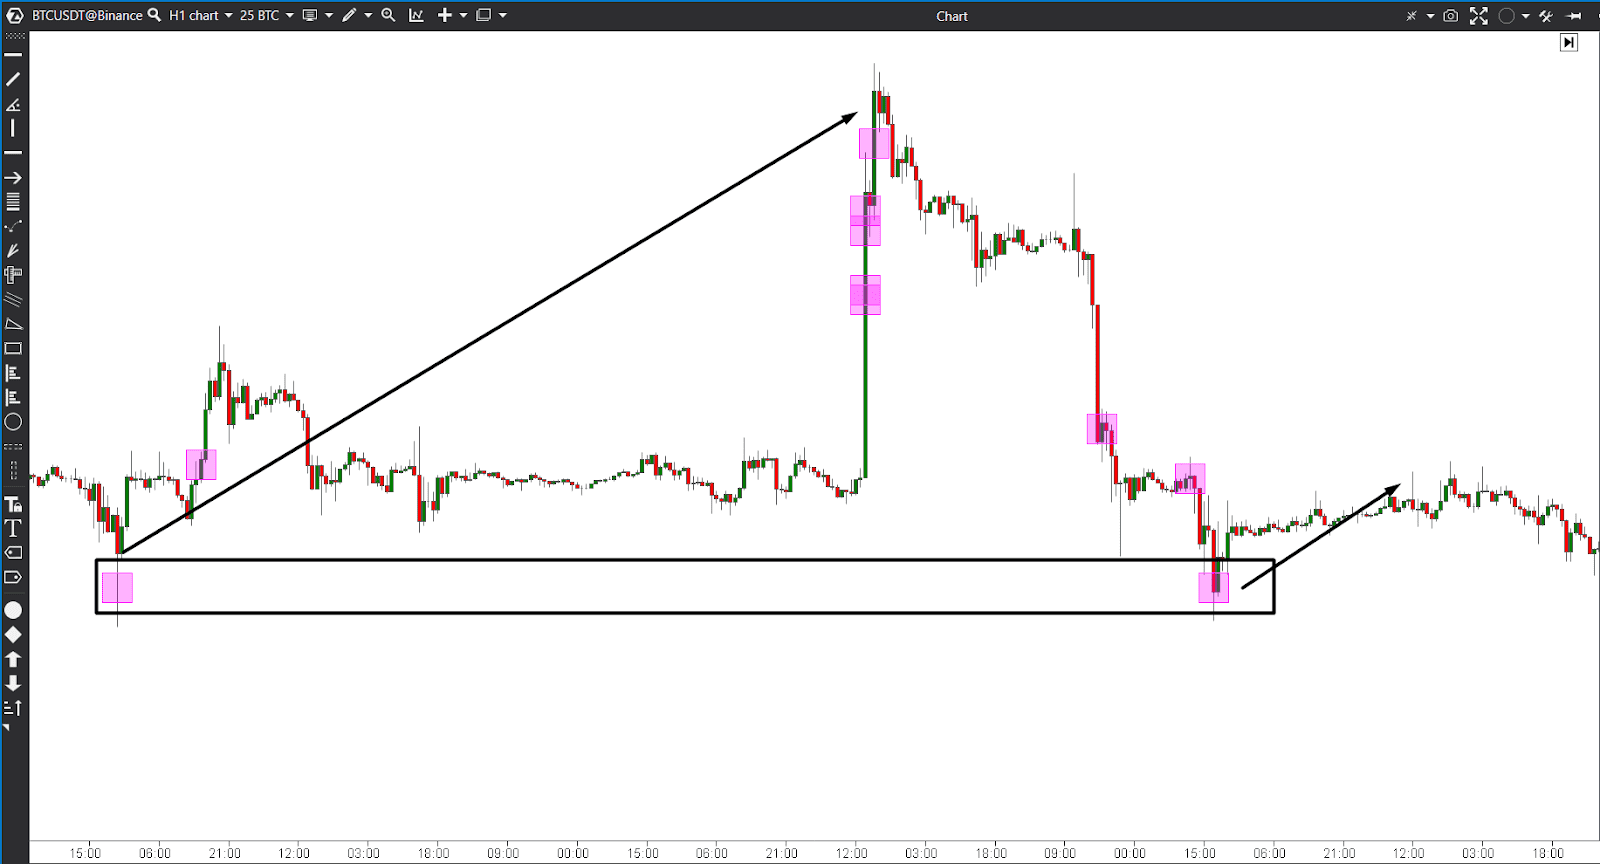
Once you have identified high volume trades, the next step is to identify potential support and resistance levels at which these trades occur. These levels often act as key turning points in the market.
- Look for patterns where the price has reversed or stopped before.
- Look for clusters of orders (buy or sell walls) near these levels, as they can indicate strong buying or selling interest.
Step 3. Determine the entry and exit points
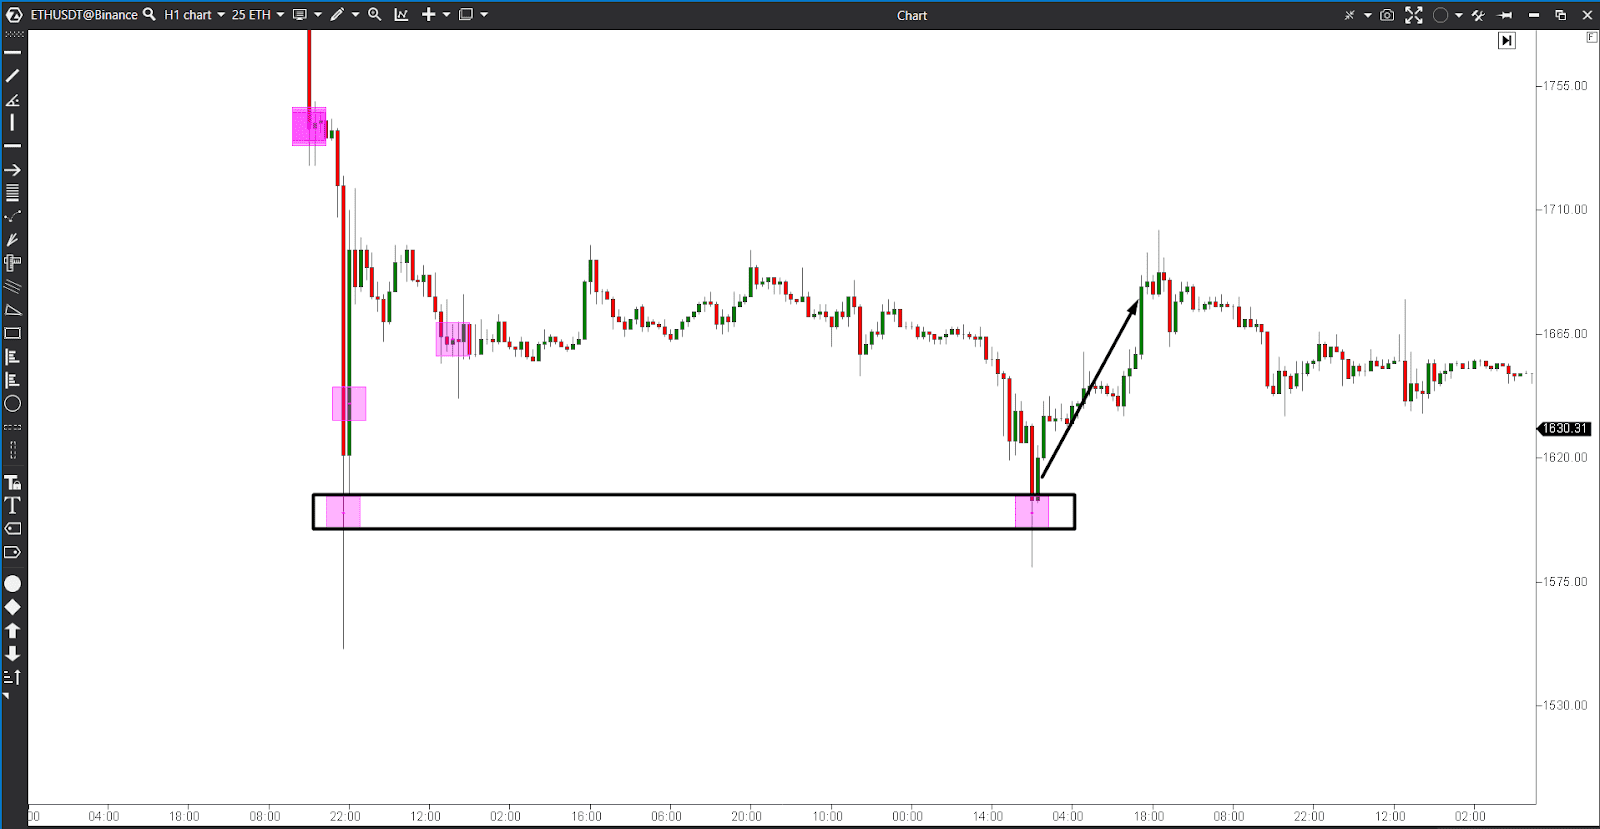
When the price approaches certain support or resistance levels and is accompanied by high volume, it can be a signal to enter a position. For example, if the price rises to a resistance level and the buying volume is extremely high, it might be a good time to open a short position. On the contrary, if the price drops to a support level and the volume of sales is high, it may be the time to open a long position. Incorporating such a footprints template into your trading strategy can streamline your analysis of high-volume market events.
What is the advantage of using Footprint to build a strategy?
- High volumes in footprints provide strong signals for entry.
- If you enter a position in time based on volume, you can make big profits from potentially strong price movements.
- Footprint trading strategies allow you to deeply analyze the market structure and understand which participants influence prices and where the price will move.
Briefly about Footprint analysis software
Footprint is a convenient tool from which traders take a huge amount of data for analysis, and it is very convenient to view it in the ATAS program – the best footprint computer software to use. Join the ATAS platform through our referral program and receive bonuses from the Bikotrading team.
This footprints software is designed specifically for order flow and volume analysis. You get access to detailed information about buys, sells, and volumes at each price level. This footprints tracking software provides traders with convenient graphical tools, indicators, and optimized volume visualization. The ATAS platform is characterized by an intuitive and user-friendly interface. Thanks to its user-friendly features, it is ideal for traders, regardless of their level of knowledge, to analyze online footprint.
In addition, we have created Order Flow and Footprint guides with unique examples and real trading cases on our YouTube channel. Follow the link and learn for free!
Conclusion
By understanding the movement of large volumes and using a footprint tracking strategy based on them, traders can filter out the truly valuable data on the charts and identify the best moments to open a trade. Big volumes will be a strong signal for a trader and will tell them when the market is ready to move.

.png)


