Volume profile: what is it and how to use it?
By Yuriy Bishko Updated February 29, 2024
BikoTrading Academy
Do you trade on the cryptocurrency market and want to earn more? Are you planning to start your way in trading but don't know what you need to do? Today we will tell you about such an important indicator as the volume profile, which will help you analyze the situation correctly and open profitable trades. Read on and find out what it is and how it works.
KEY ISSUES:
What is Volume Profile?
Volume Profile is an indicator that displays the number of open orders at a particular price level. For example, we all know that when Bitcoin is falling, you should buy it, and when it is rising, you should sell it. In this case, at the lower and upper price levels, the bars of the indicator will be larger, because then a larger number of trades are activated.
The indicator is displayed in the form of a horizontal bar chart. It also serves as an indicator of the level of resistance and support in the market. The volume profile is often confused with the vertical volume indicator and the market profile. Let's see what the difference is:

To better understand the mechanics of using the indicator, let's look at the example of the DOGE/USDT pair:
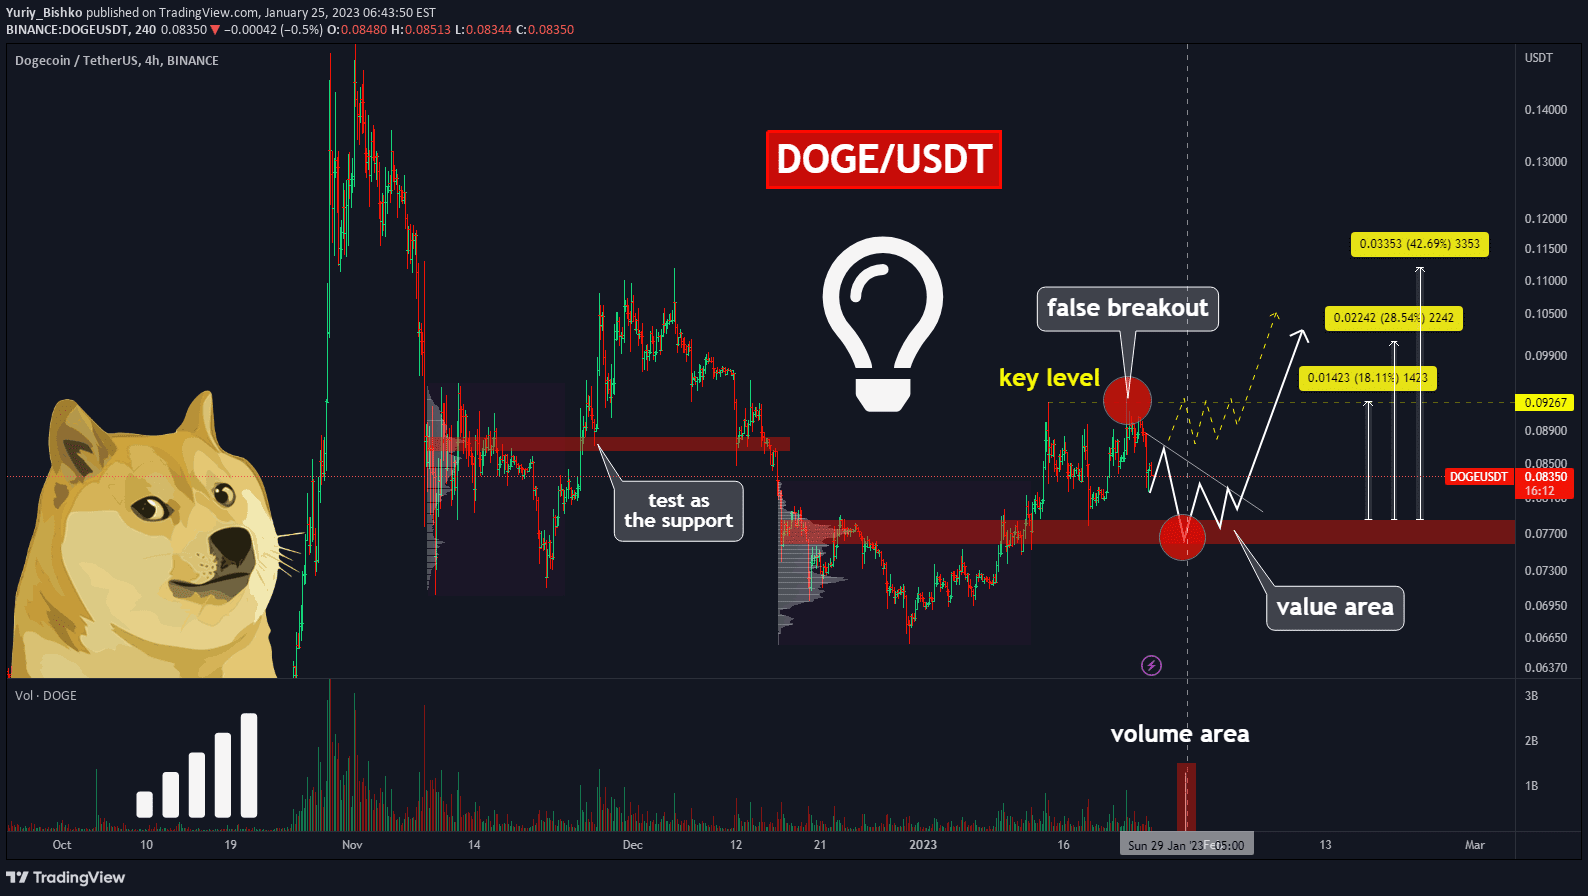
First, we find the support level and wait for the coin to test it. The next step is to analyze the indicator and determine the area of potential growth for the cryptocurrency. The screenshot shows that this point has coincided on both the horizontal and vertical volumes. We are waiting for the price level of $0.075-0.078 to be tested as support, mark the key level at $0.083, notice a false breakout at $0.092, and predict a trend reversal with the potential for the coin to grow to $0.010. We will evaluate our forecast a little later:
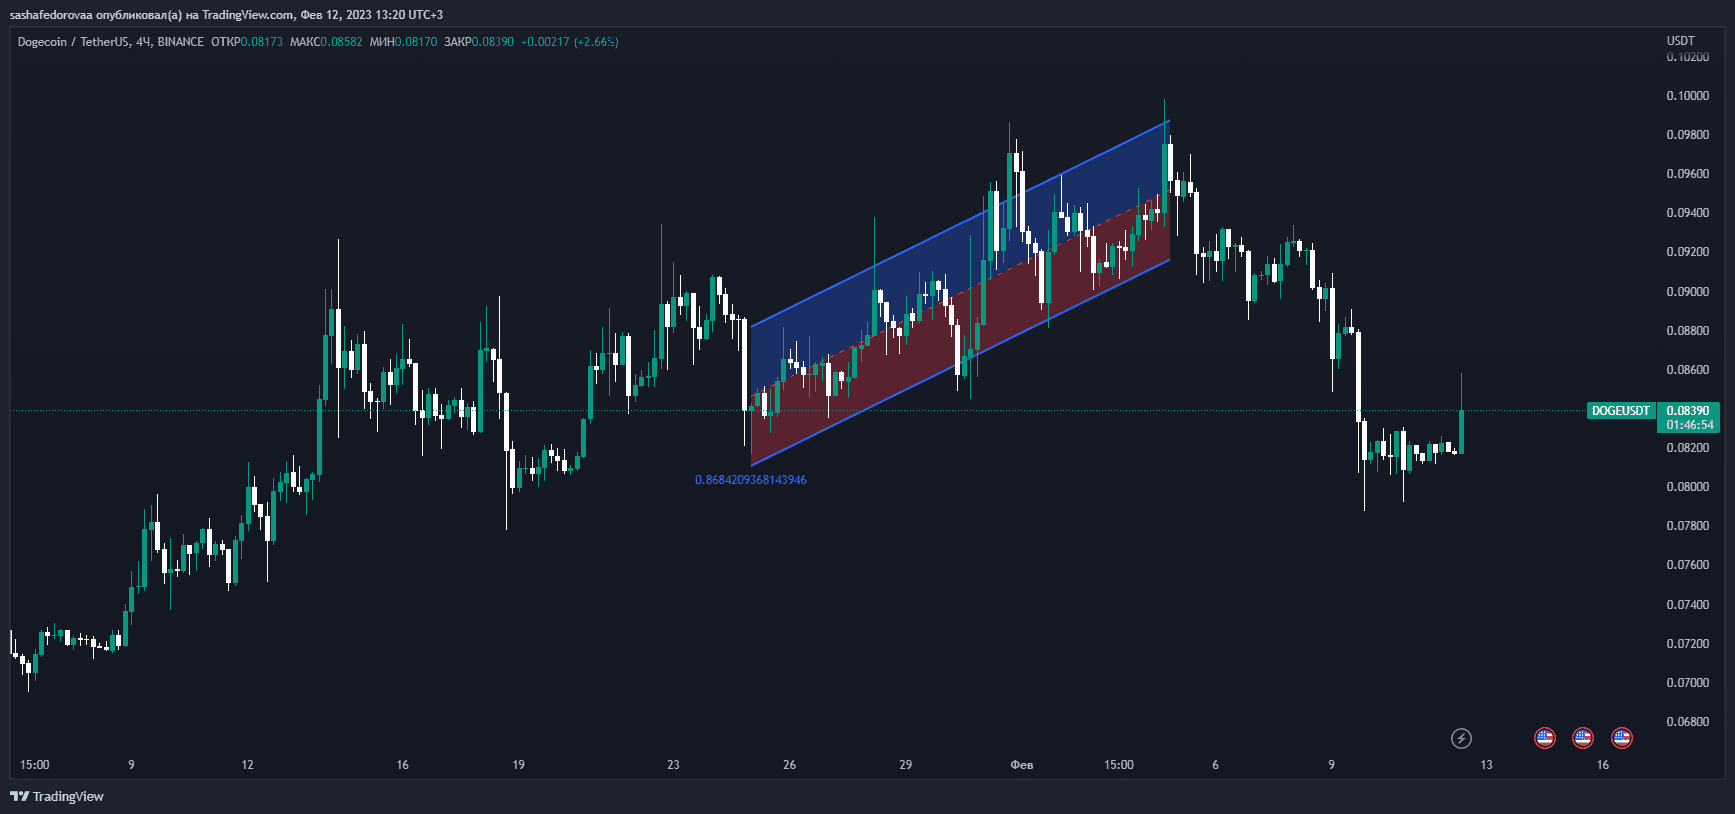
As you can see, our predictions confirmed: DOGE made a false breakout and went long, reaching almost $0.010. Thus, horizontal volume analysis would have helped us to open a profitable trade and make money. We recommend analyzing several indicators at the same time (footprint, trading volume, DOM, etc.) to check your own forecast and make sure you are right.
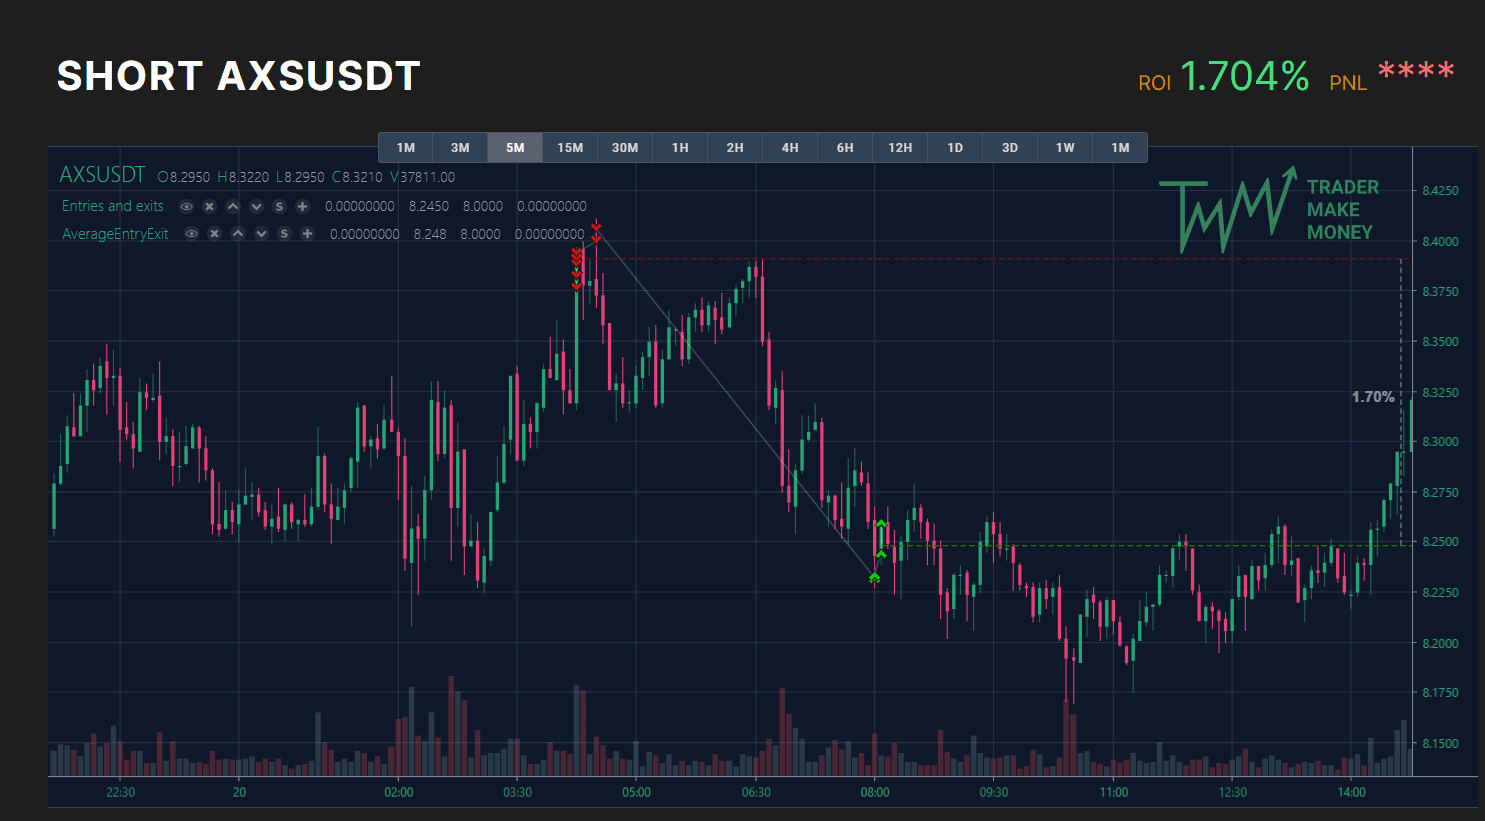
Another great example is our student's trade on the AXS/USDT pair:
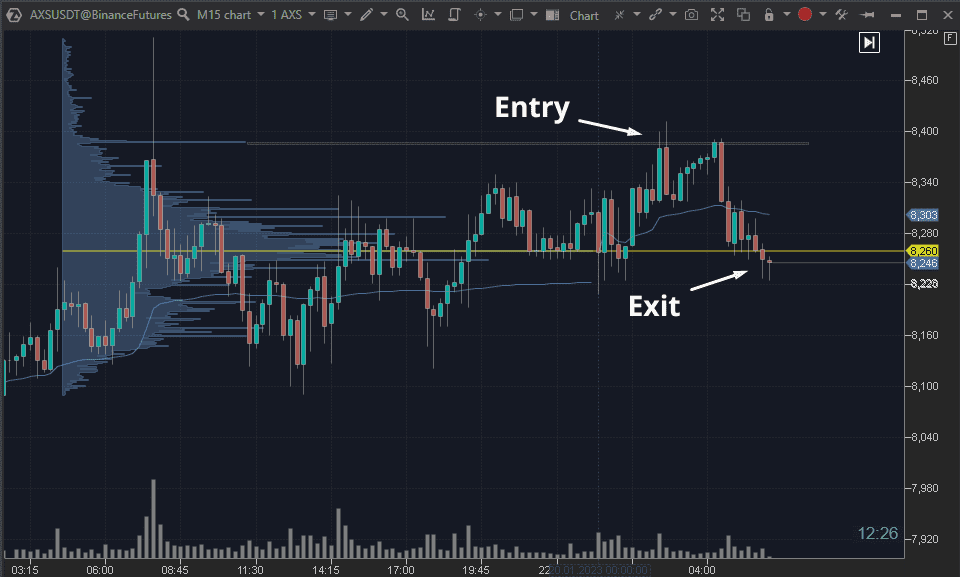
Noticing the high volume that the coin was testing, he opened a short trade, after which the price of AXS fell from $8.38 to $8.24. This brought the student an ROI of 1.704%. This situation is a very accurate example of how horizontal volume works.
If this is not enough, we have prepared a free strategy to help you trade even better and with more confidence:
DOWNLOAD PDF WITH THE STRATEGY | FOR FREE
Platforms with a volume profile
Okay, so we've described the importance of the indicator, but where and how to use it? The volume profile is available on two popular platforms - TradingView and ATAS. Each of them has its own advantages and disadvantages, so let's consider them in turn.
TradingView
TradingView is a popular social network and platform for traders that collects data on cryptocurrencies (price, charts, capitalization, etc.), as well as tools for analyzing coins (indicators, tools for drawing on charts, trades of other players, chats between traders, etc.). This is where the Volume Profile, or horizontal volume, is available, and the chart with the indicator looks as follows:
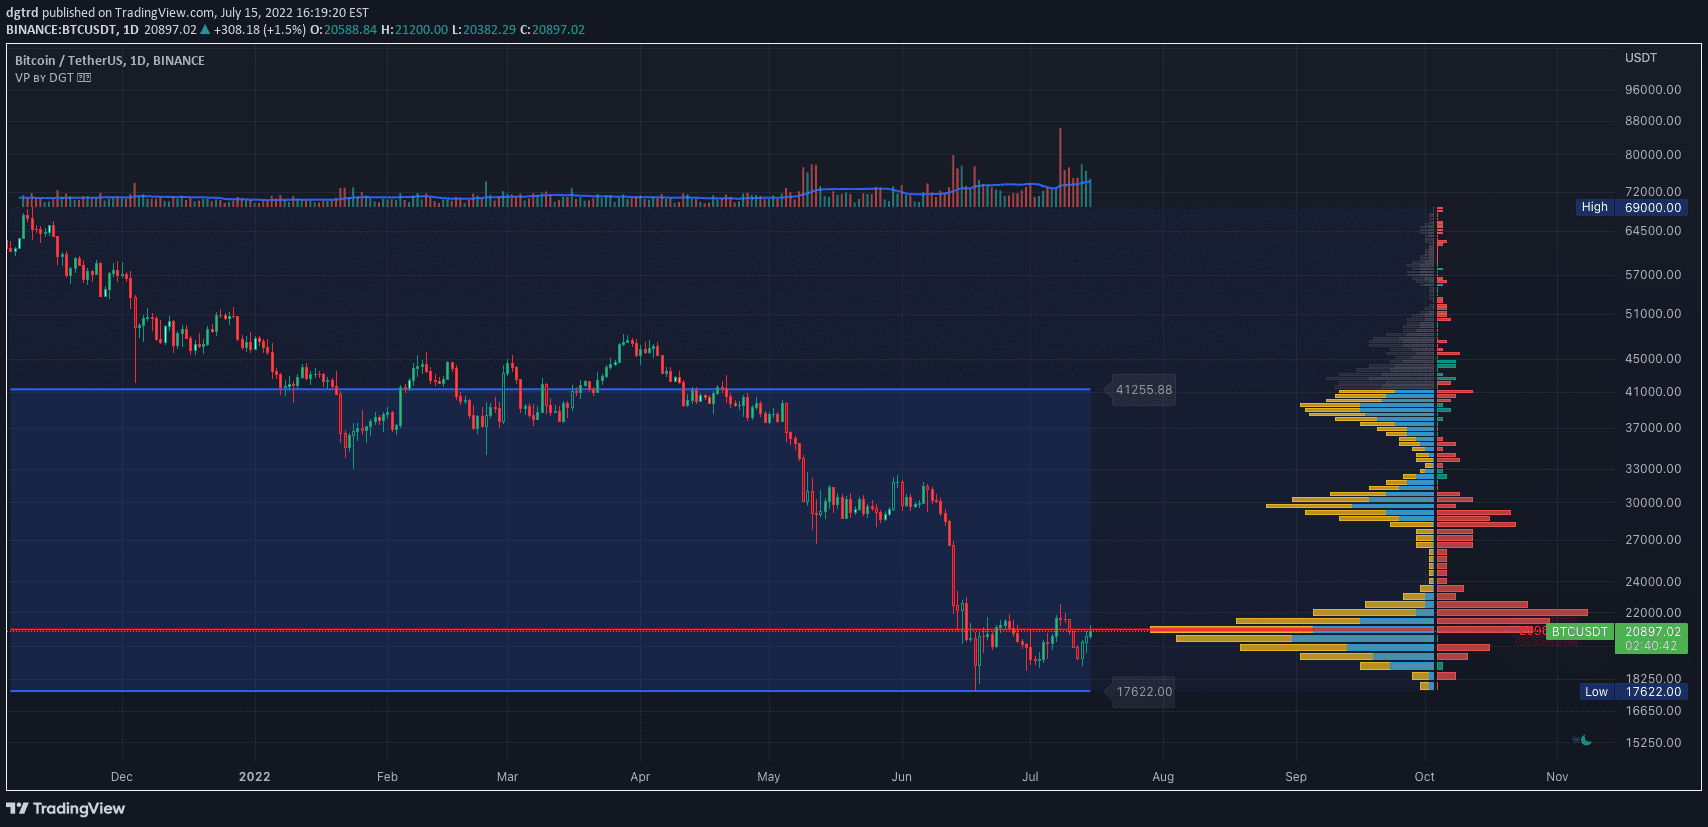
The advantages of the platform include:
- Simple and intuitive interface;
- Compatibility with different operating systems (MacOS, Windows, etc.);
- Availability of browser and desktop versions;
- Attractive and customizable design (colors, themes, etc.).
ATAS
ATAS is a trading and analytical platform designed for order analysis. There is neither an exchange nor chats between traders, but it contains all the important indicators that are available for FREE for the cryptocurrency market. We've been using it for several years now, so we can safely recommend it. Download it using the link below and get our custom indicators as a gift!
DOWNLOAD ATAS FOR THE CRYPTOCURRENCY MARKET
The main disadvantage of ATAS is that it is available only for Windows, which means that you cannot use the platform from a smartphone or tablet. In other aspects, ATAS is not far behind TradingView. The chart with the indicator looks as follows:
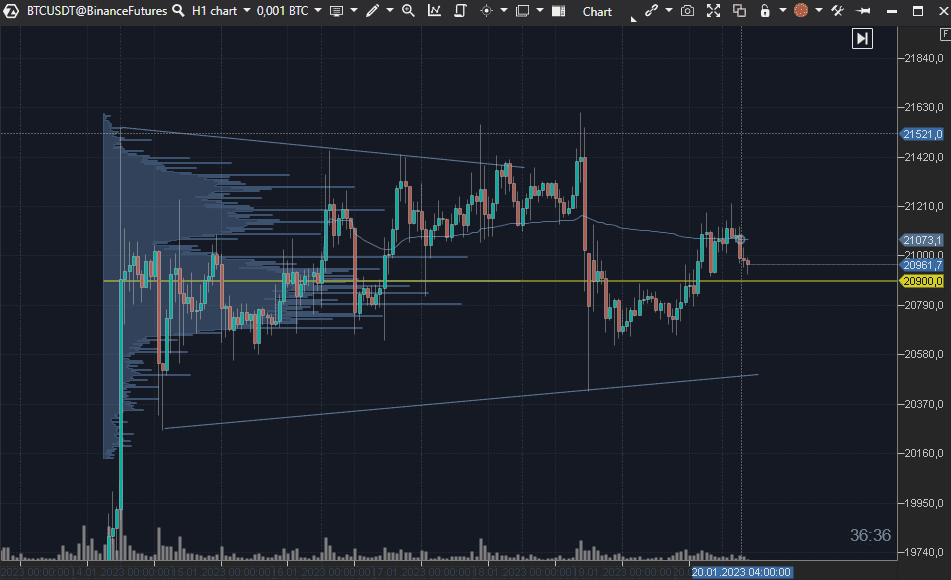
Among the platform's benefits are the analysis and use of data from many exchanges simultaneously (Binance, Bybit, etc.), more accurate volume profile indicators and others, free access, the ability to view the analysis history, and 400+ cluster display options.
ATAS vs TradingView: which is better?
To illustrate the difference between the platforms, we suggest looking at the same APT/USDT pair and opening the volume profile:
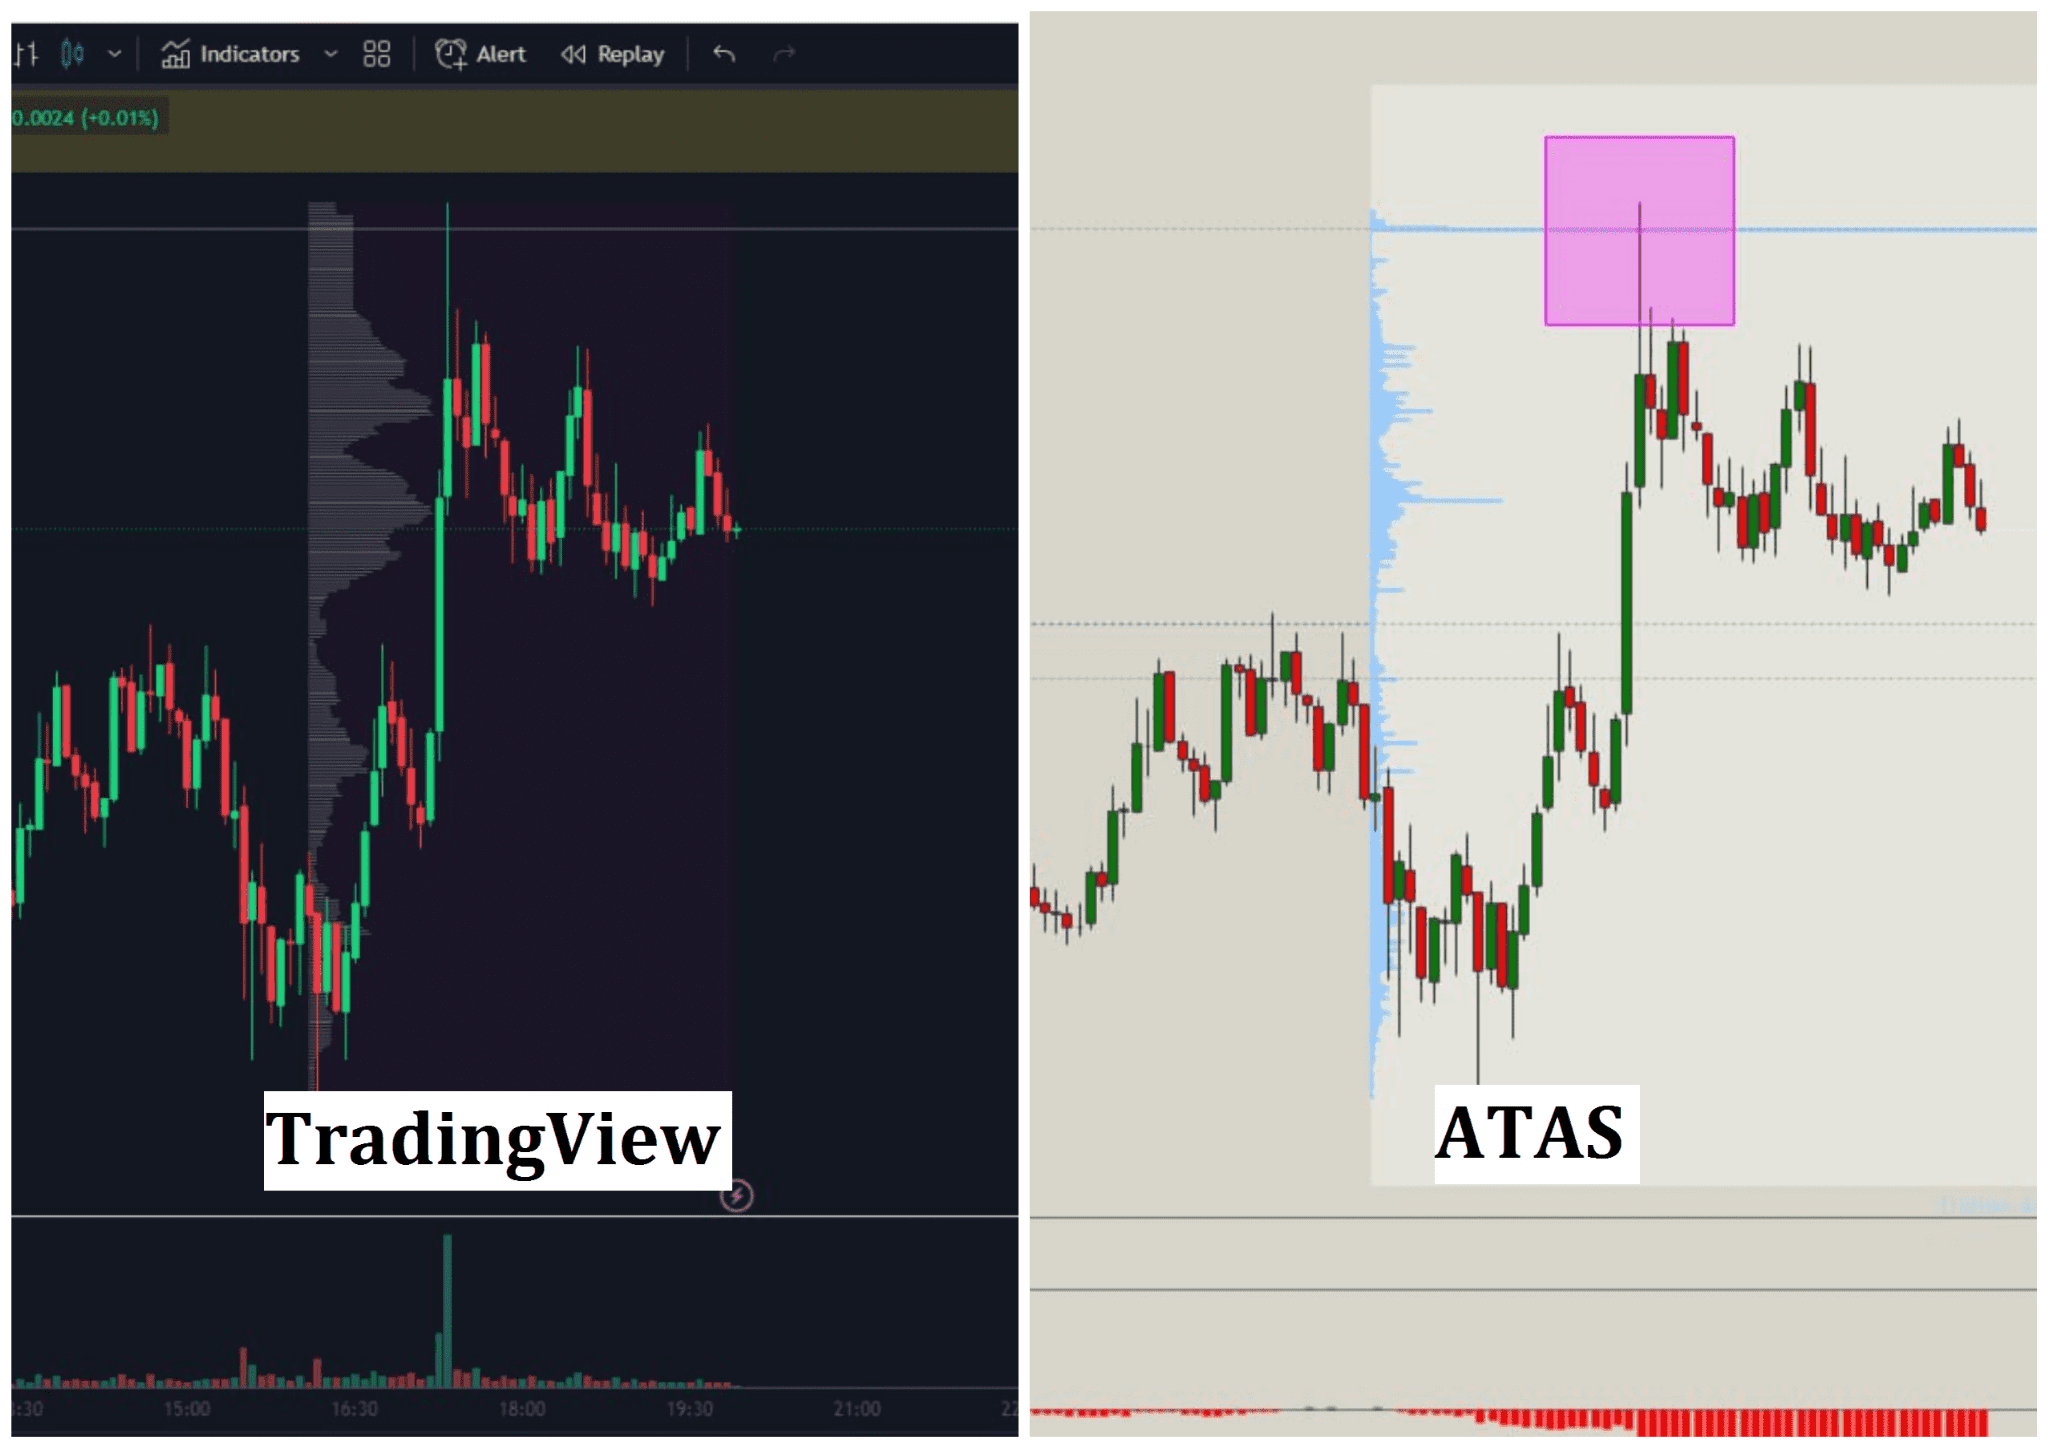
As you can see, the data of the volume profile indicator is displayed much more accurately in ATAS than in TradingView. In the latter, there are no clear bars, and therefore it is unclear at which price level the largest number of transactions was made during the period. In ATAS, we can see at which moment there were more orders on the chart, while in TradingView the bars seem to "merge" with each other.
Ensure reliability of your trading operations: Why we chose ByBit exchange?

Our team has chosen ByBit exchange because it offers the best conditions for efficient and reliable trading. This has become particularly relevant with recent events surrounding Binance, which has issues with security and regulation. Thanks to advanced technology and reliable security, ByBit allows us to conduct fast and successful operations, making it the ideal choice for traders.
Additionally, ByBit has high liquidity, allowing us to open and close our deals instantly. With the trading API provided by the exchange, we can connect our technical tools (DOM, Footprint) and strategies to achieve the best results in cryptocurrency trading.
So, if you're looking for a reliable and efficient platform for cryptocurrency trading, we recommend trying ByBit and experiencing its advantages for yourself.
Conslusion
Volume Profile is an important indicator that helps to determine support and resistance levels and analyze where the chart will move in the future. The indicator is available on TradingView and ATAS platforms. Choose TradingView if you can afford to pay $155 per year and want to use the platform from any device, or ATAS if you are looking for a free program on Windows. Good luck!

