What is technical analysis in crypto trading
By Yuriy Bishko Updated Sep 18, 2023
BikoTrading Academy
Technical market analysis is a way to determine future price behavior by identifying statistical patterns of price behavior. The basics of technical analysis include: chart analysis (detection of levels of support, resistance and graphic figures), indicator analysis (mathematical algorithms that determine differences, levels of being overbought and oversold), candle analysis and trend determination (market direction).
What is technical analysis?
I am 99% sure that almost every beginner, including you, started their way in trading with personal attempts to make money on price fluctuations. But after futile efforts and significant losses, beginners either hopelessly leave the market or reject illusions and begin to explore the possibilities of how to predict price behavior, and of course make money on it.
Opening trades on your own intuition can be compared to a casino and a lottery. This path has only one end, and that is the loss of your capital. But trading is not a casino. The price follows certain rules and laws. In order to make money in the financial markets, you should use the laws of price behavior to your advantage. And in trading technical analysis is the key to this!
When getting started in technical analysis for crypto trading, it's essential to begin with the foundational principles and gradually explore more advanced strategies.
- Technical analysis charting is a valuable tool to determine future price behavior by identifying statistical patterns of price behavior.
- Similar to EUR USD technical analysis, it helps to predict market changes and improve trading results.
- Technical analysis using multiple time frames can offer a more comprehensive perspective on cryptocurrency price movements.
- Candlestick technical analysis, another essential aspect of crypto trading for beginners, can reveal crucial information about the current and potential market sentiment.

Yes, I agree, it sounds complicated, but in fact everything is much easier than it seems! Let me give you a few examples.
Doing the chart technical analysis, traders noticed that the price is not just chaotically moving up and down, but has certain levels (support and resistance). There are 2 charts below. One without levels, the other with levels.
We can clearly see how the price falls sharply after the level breakout, and how it unfolds after the test as a resistance.

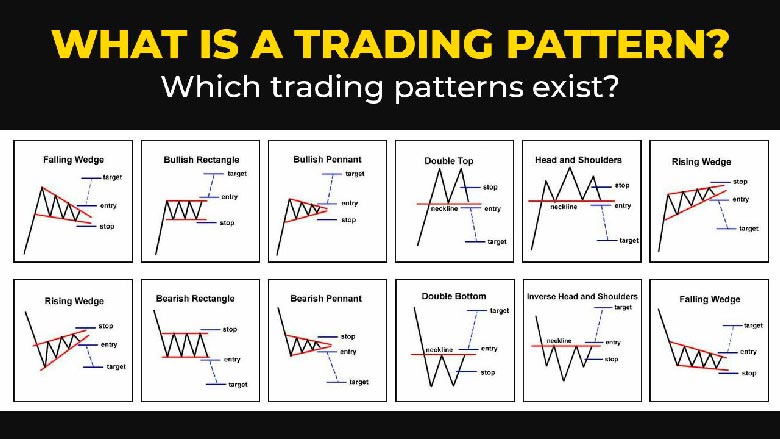
Another example. Traders also noticed that in addition to levels, you can also find various figures on the charts, as they are called "patterns of technical analysis". As a result of the breakout pattern in technical analysis, the price in most cases moves further towards the breakout.

Here are some examples of statistical patterns on the price chart. As a result of using such patterns in technical analysis, we can predict the following price behavior.
Fundamentals of technical analysis
In this part we will analyze the main elements of technical analysis of the financial market, with which you can predict the movement of cryptocurrency. The technical analysis triangle consists of three key elements: support and resistance levels, trendlines, and chart patterns, all of which play a crucial role in analyzing and predicting price movements in the cryptocurrency market. Chart, indicator, and candle analysis are the basis of technical analysis tools to start with.
Chart analysis - the most popular method of analysis, the main task is to identify graphic figures and levels of technical analysis. Charting and technical analysis are essential tools that help to navigate the volatile markets. Chart patterns in technical analysis offer traders valuable insights into potential price movements and trends.
Historically, it has been found that the price periodically repeats technical figures, making a breakout of the price of figures and levels gives traders an understanding more likely to determine where the price will move next.
For example, in technical analysis head and shoulders figure identifies the distinctive peaks and troughs and provides valuable insights into potential trend reversals and price targets. Also, in technical analysis Fibonacci retracement levels are a popular tool used to identify potential support and resistance levels in a price chart.

Indicators - the second, but almost integral method of crypto technical analysis. This method of analysis is based on mathematical formulas and statistical approaches. When talking about technical analysis crypto traders rely on historical price data and various indicators. Indicators can determine the levels of overbought and oversold market, confirmation or discrepancy between price and real indicators, as a result of which the trader more accurately determines future growth and decline in price. The advantage of indicators of technical analysis is the absence of the human factor.
Candle analysis- in addition to graphic figures and indicators, you can additionally analyze price candles and combinations from a set of candles, which clearly predict and determine the next price behavior! In technical analysis candlesticks play a crucial role as they offer a visual representation of price action, allowing traders to gauge market sentiment. Technical analysis learning of this aspect includes understanding various candlestick patterns, recognizing bullish and bearish signals, and interpreting the significance of candlestick formations in different time frames.
Market trend - analysis of levels, graphic patterns, indicators and candle structures significantly increases your opportunities in front of other market players, and of course already provides an opportunity to trade for profit. But without the ability to correctly determine the market trend, you will almost not be able to earn extra profits.
The market has 3 stages of trend: upward, downward and sideways. Appropriate trading strategies should be used for each stage of the market. If the market moves downward, and you open positions to buy, even if the chart has the appropriate levels or technical structures, you will almost not be able to make a profit, because the market is simply not moving in your direction.
Within our course on technical analysis, we cover different approaches to trading, helping our students to read the market accurately and b
Summary
The presented elements of technical analysis make it possible not to guess the direction of price movements, but to rely on real mathematical and statistical indicators. Learning technical analysis will help you build your own trading algorithm and finally start earning a steady income. There’s no need to choose between technical analysis vs fundamental analysis, traders have to do both to achieve good trading results.