Candle analysis for crypto trading
By Yaroslav Krasko Updated November 11, 2022
BikoTrading Academy
The trading candle is not just a kind of price display, it is a tool on the basis of which the whole system of analysis is built. By identifying candle structures, you can clearly predict future price movements and understand the psychology of players.
What is candle analysis?
So candlestick analysis is one of the types of technical analysis that can be used to predict further price movements.
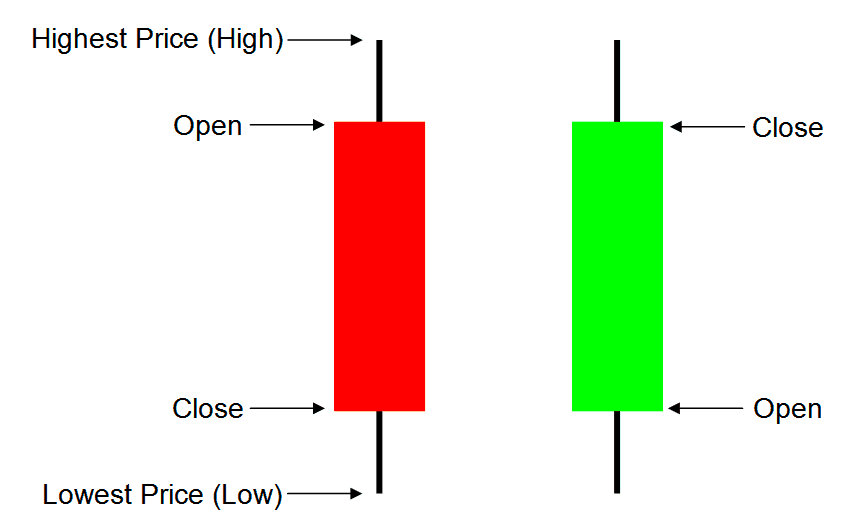
To begin with, let's understand the basic concepts. What is a candle and what is worth knowing about it? The candle reflects the price change for the set period (minute, hour, day and any other time period). In addition, the trading candle has three main parameters:
- Candle body – displays the range of opening and closing prices for a set period.
- Candle shadow – displays the maximum and minimum price values for the set period.
- Color or type of candle – green (bull candle) indicates an increase in price relative to the closing of the last candle, as well as in the opposite direction, red (bear candle) indicates a decrease in price relative to the closing point of the last candle.
Types of candles and patterns of candle analysis
Different candlestick structures and candle shapes at some point may indicate weakness or, conversely, the strength of buyers and sellers, which in turn will help us open a position at a better time, or, conversely, fix our profits before the reversal.
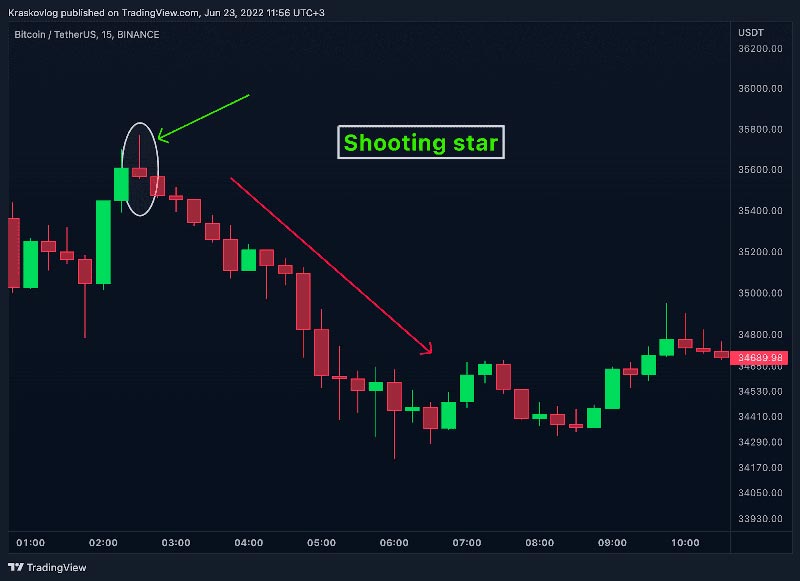
Shooting star
A bear candle, which signals the weakness of buyers and says that then with a high probability the initiative will pass into the hands of sellers and the price will begin to fall. Characteristics: almost no lower shadow, short body and long upper shadow of the candle. It is usually formed at the peak values of the upward trend and warns of its change.
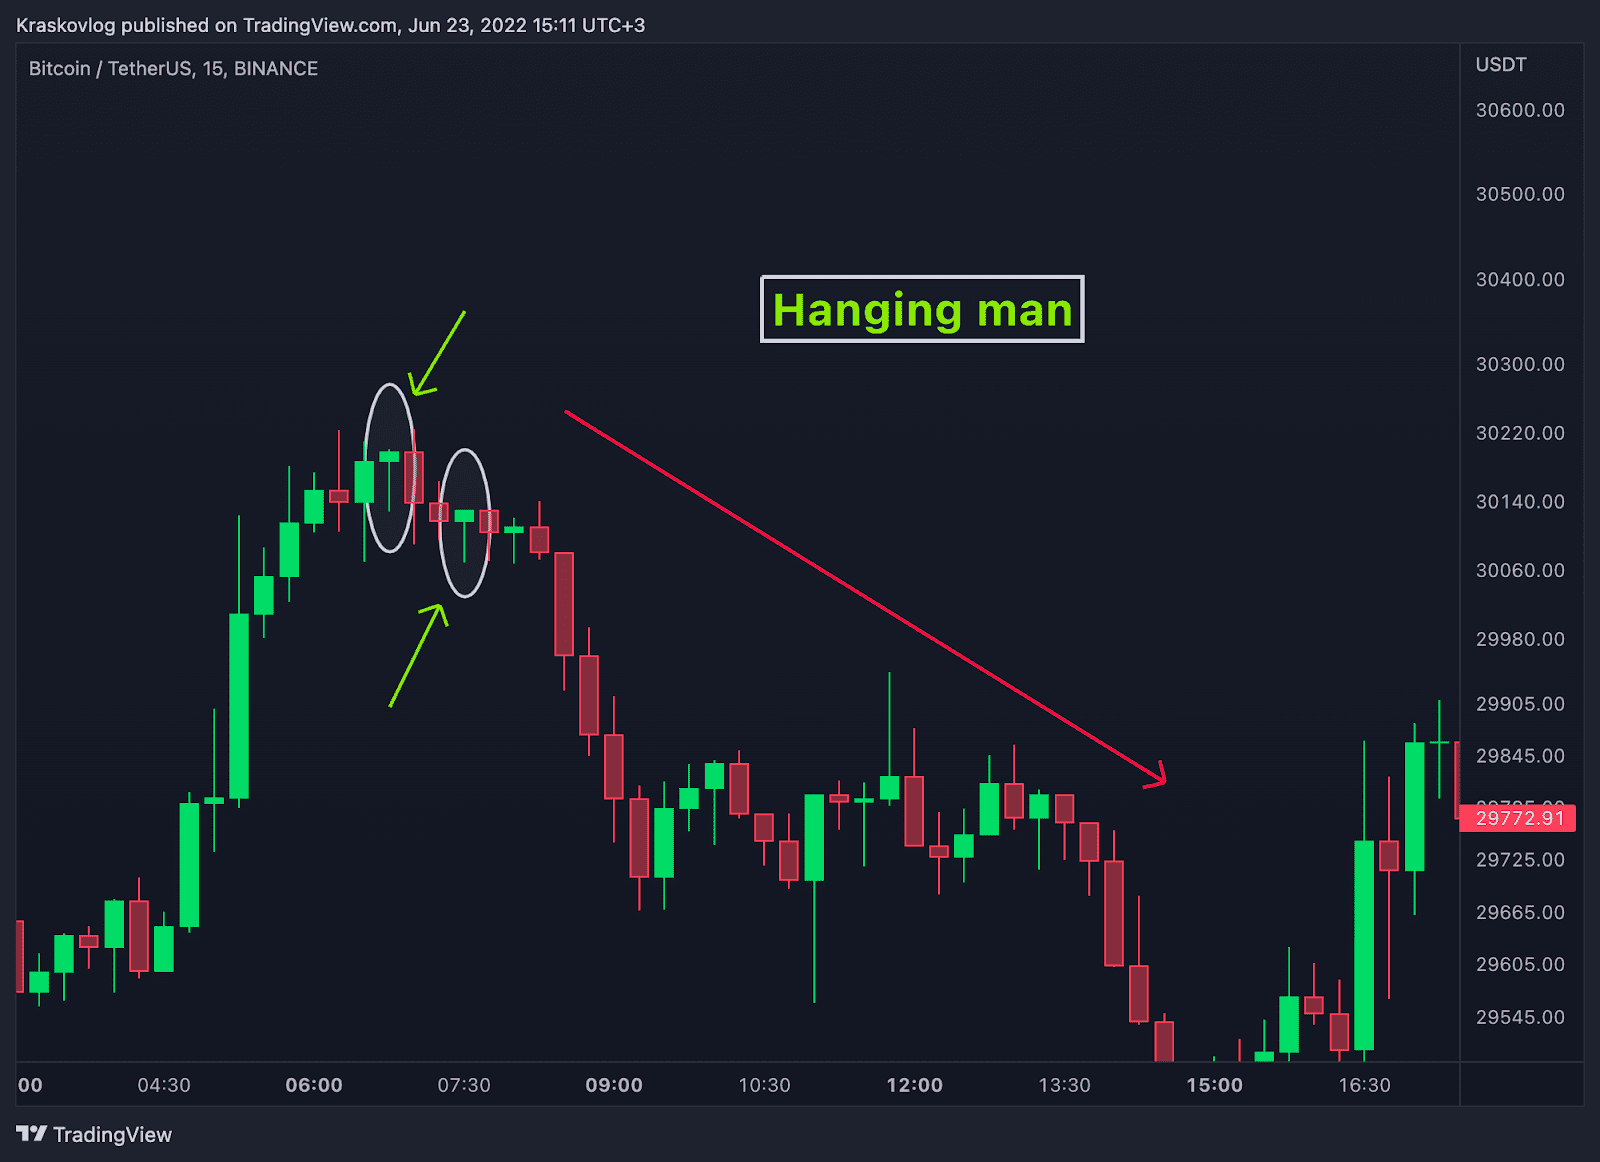
Hanging man
Another well-known candlestick structure, which indicates the imminent reversal of the trend and falling prices. Characteristic: no shadow at the top, short body and long shadow at the bottom, can be any color.
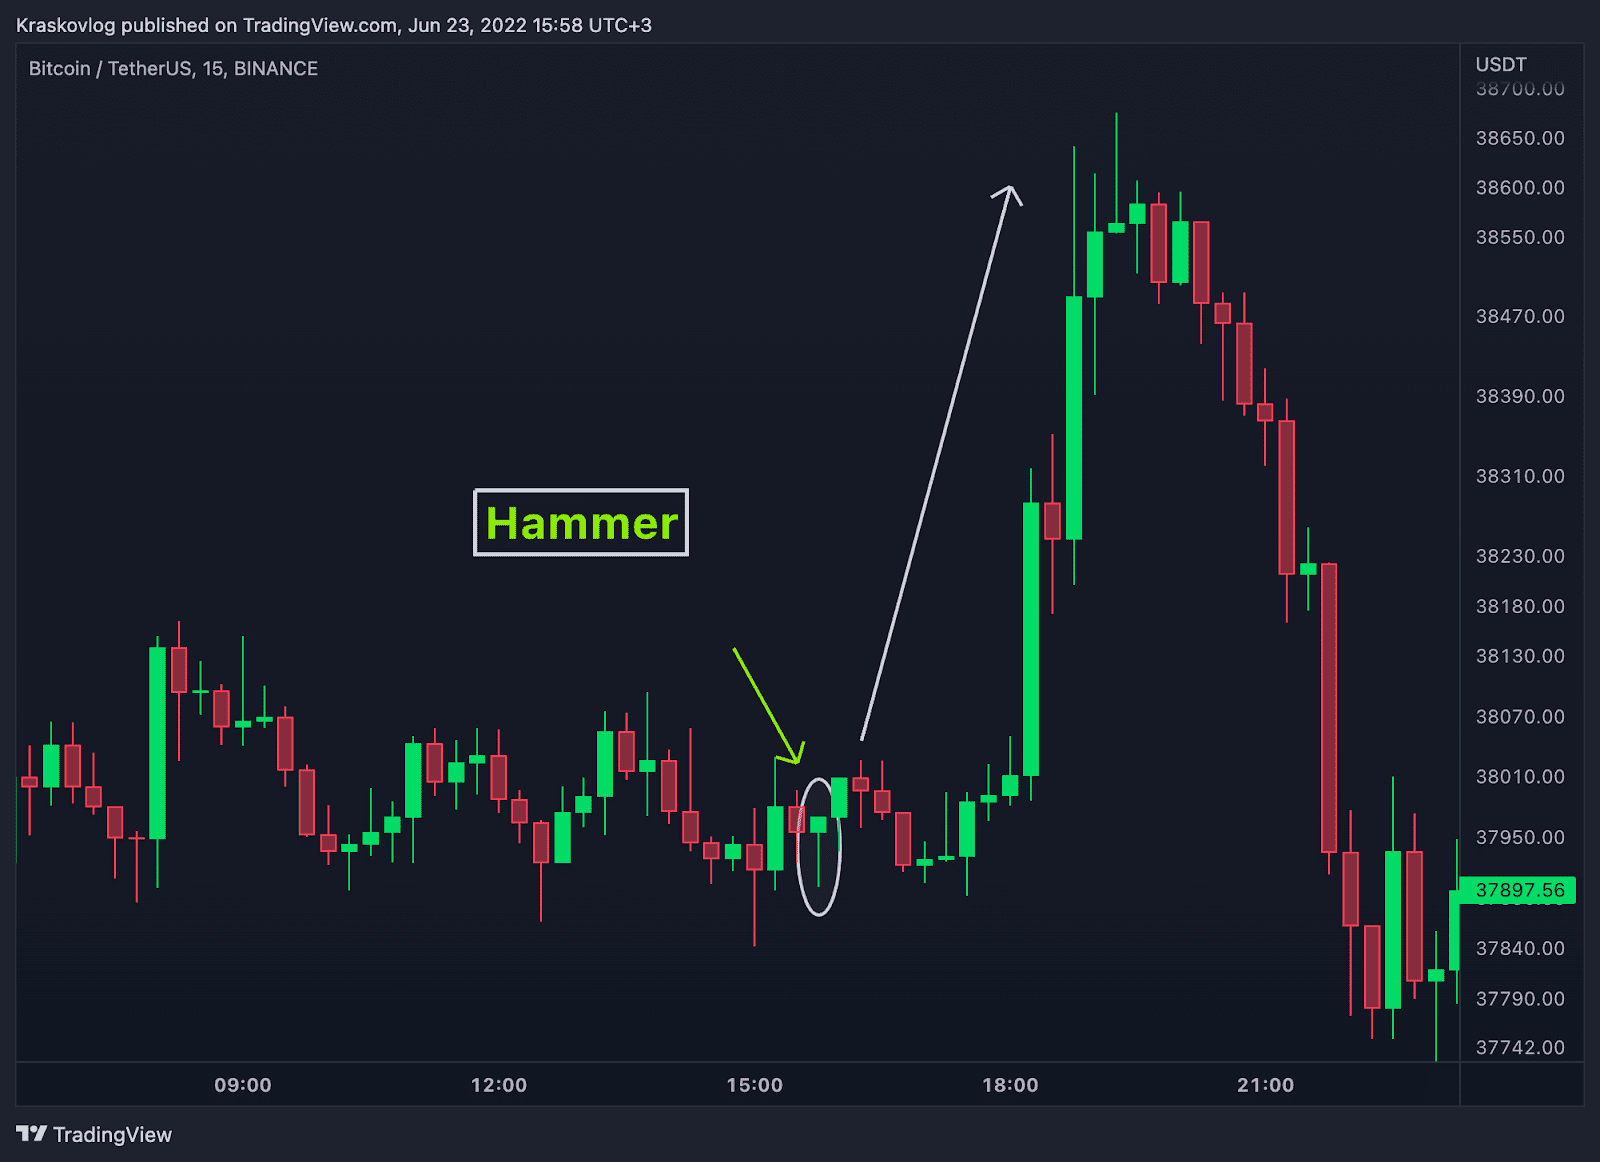
Hammer and inverted hammer
Candlestick structures that appear at the end of a downward trend and indicate its imminent reversal. They are characterized by long shadows on one side, no shadows on the back and a short part of the body of the candle.

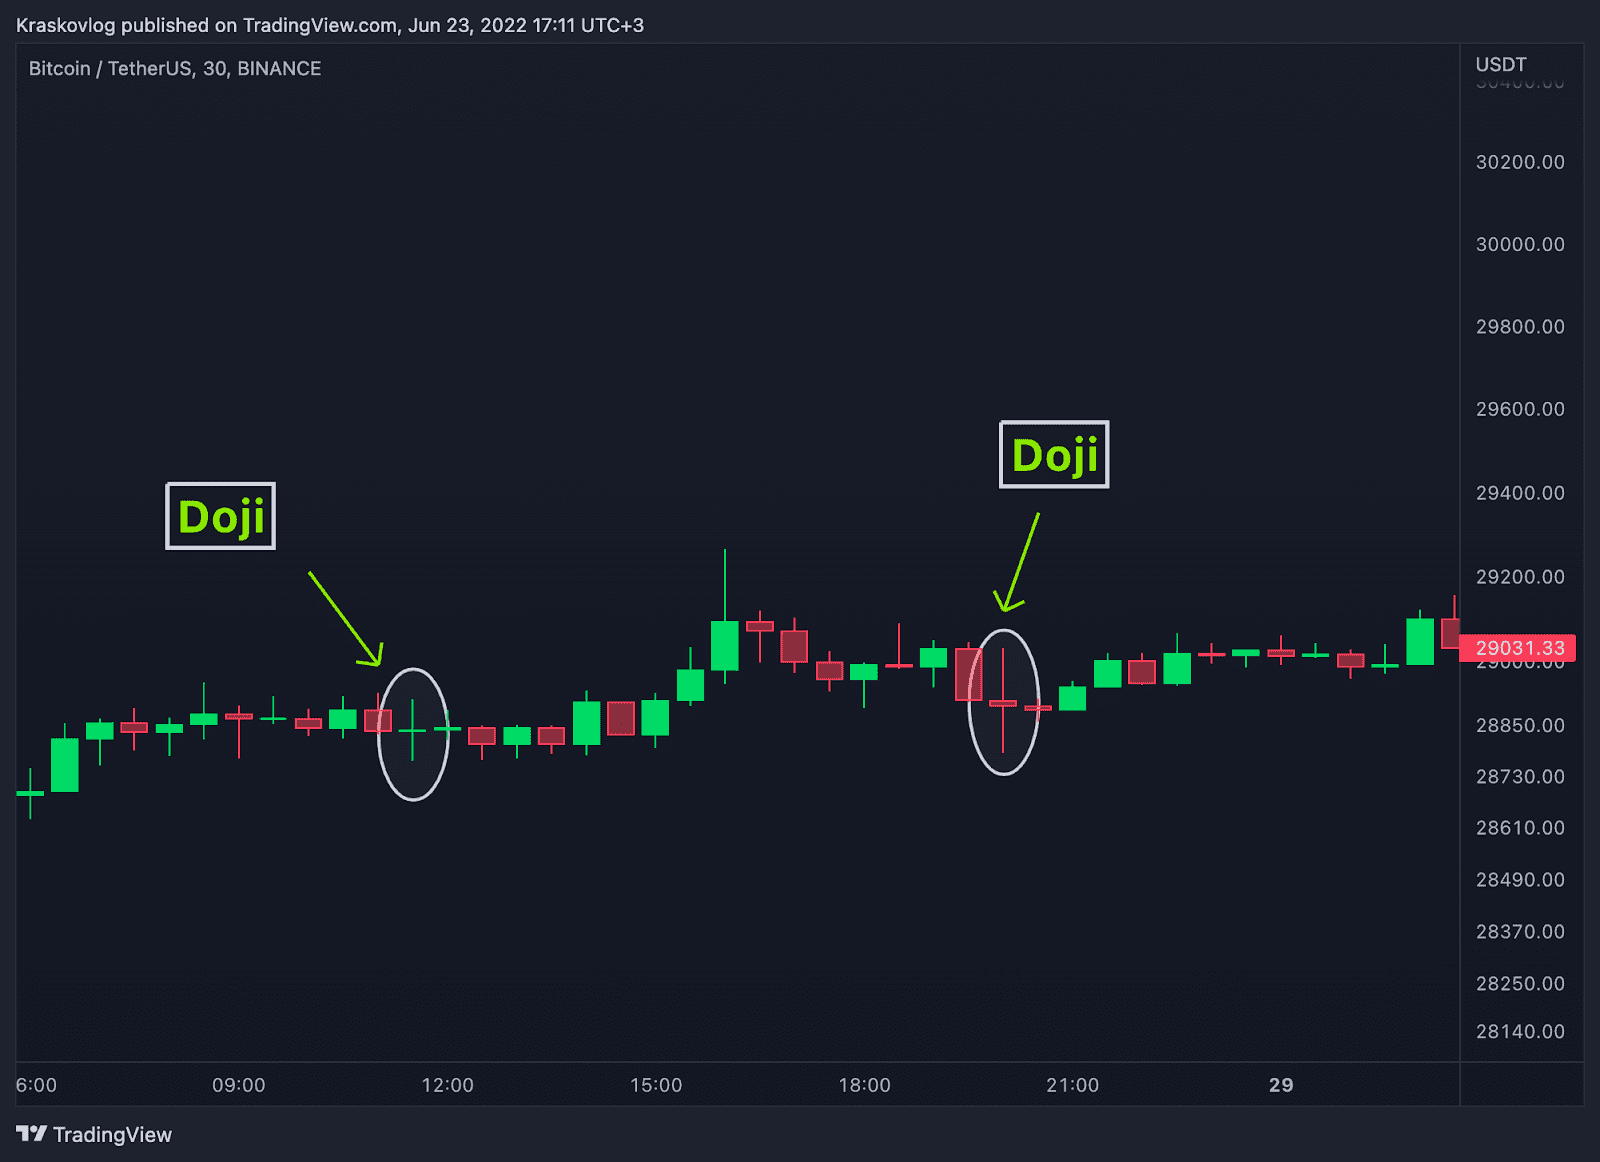
Doji
The type of candles, which is quite easy to detect on the chart, the main feature of candles is that they have almost no body, i.e. the opening price is equal to the closing price. The shadows of the candles are almost identical in size on both sides. This type of candle does not carry significant information, but only indicates that the price is in the balance between buyers and sellers. If the doji appears during a downward or upward trend, it indicates that the balance of sellers and buyers has reached equilibrium and you should expect a reversal of the trend, or the beginning of consolidation (sideways trend).
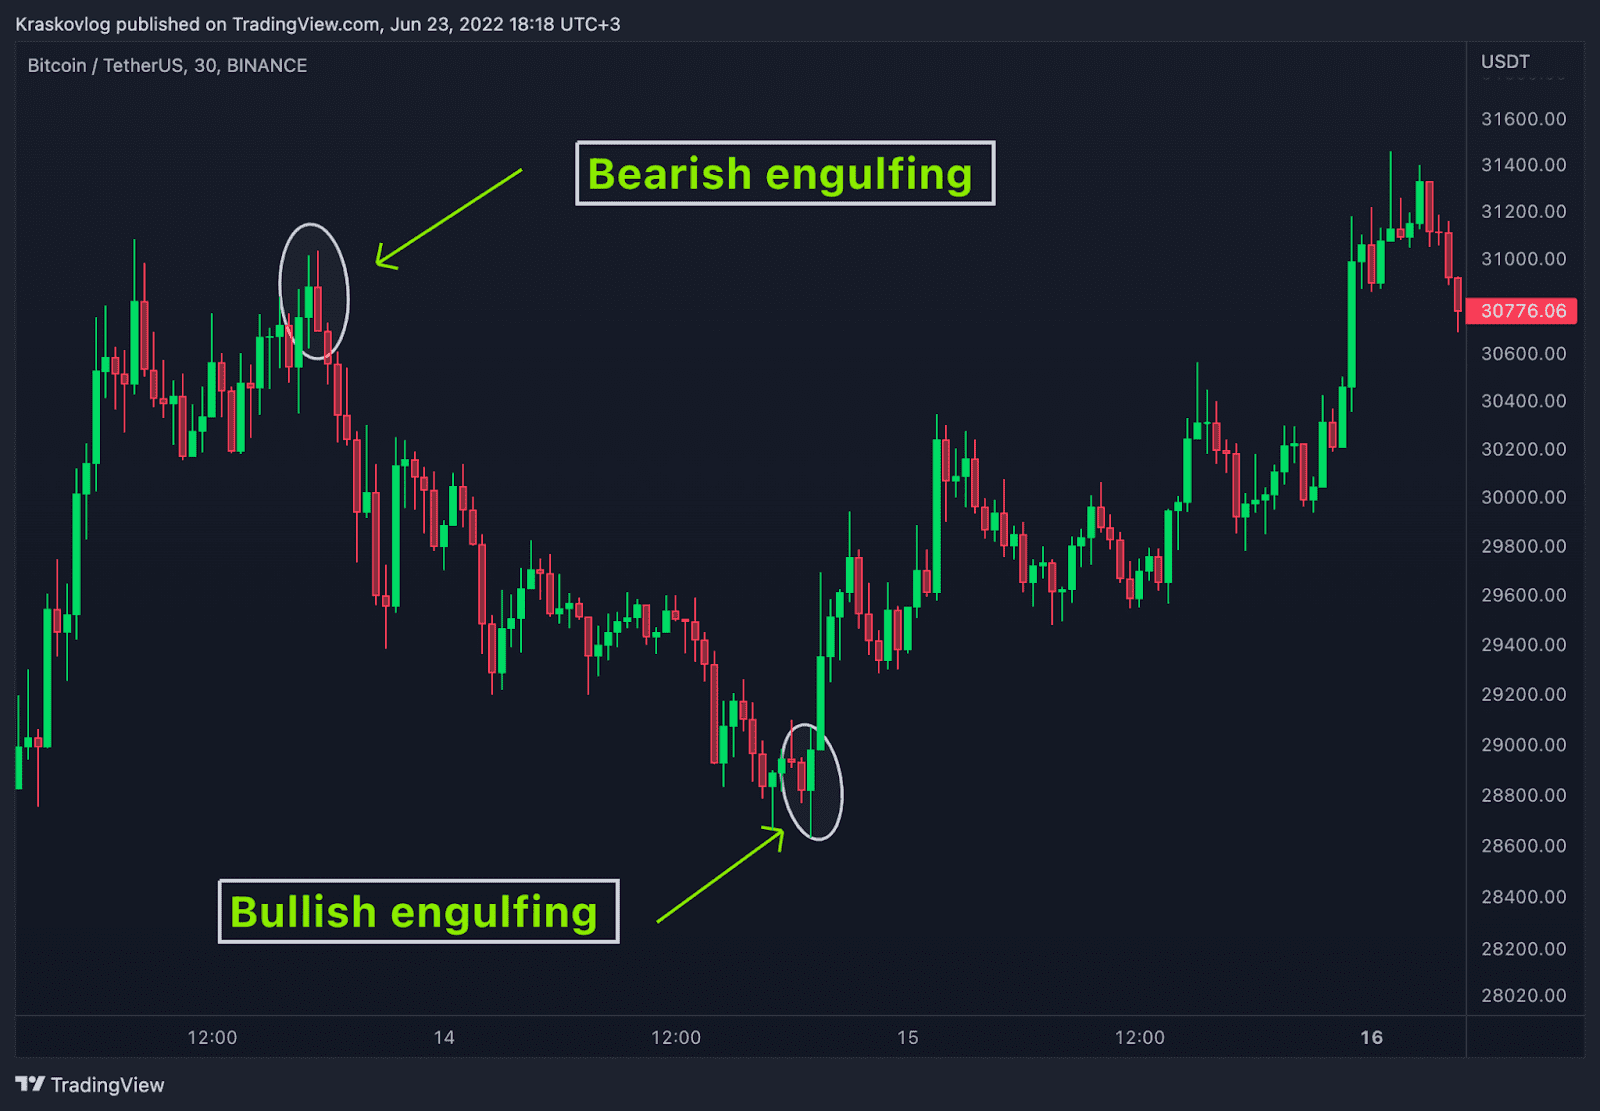
Bullish and bearish engulfing
The type of candles that is definitely worth noting. Such candlestick structures appear during the upward and downward trend. It is characterized by the overlap of the past candle (ie, complete absorption of past price movements). In turn, this indicates the interception of the initiative by buyers or sellers and the future reversal of prices.
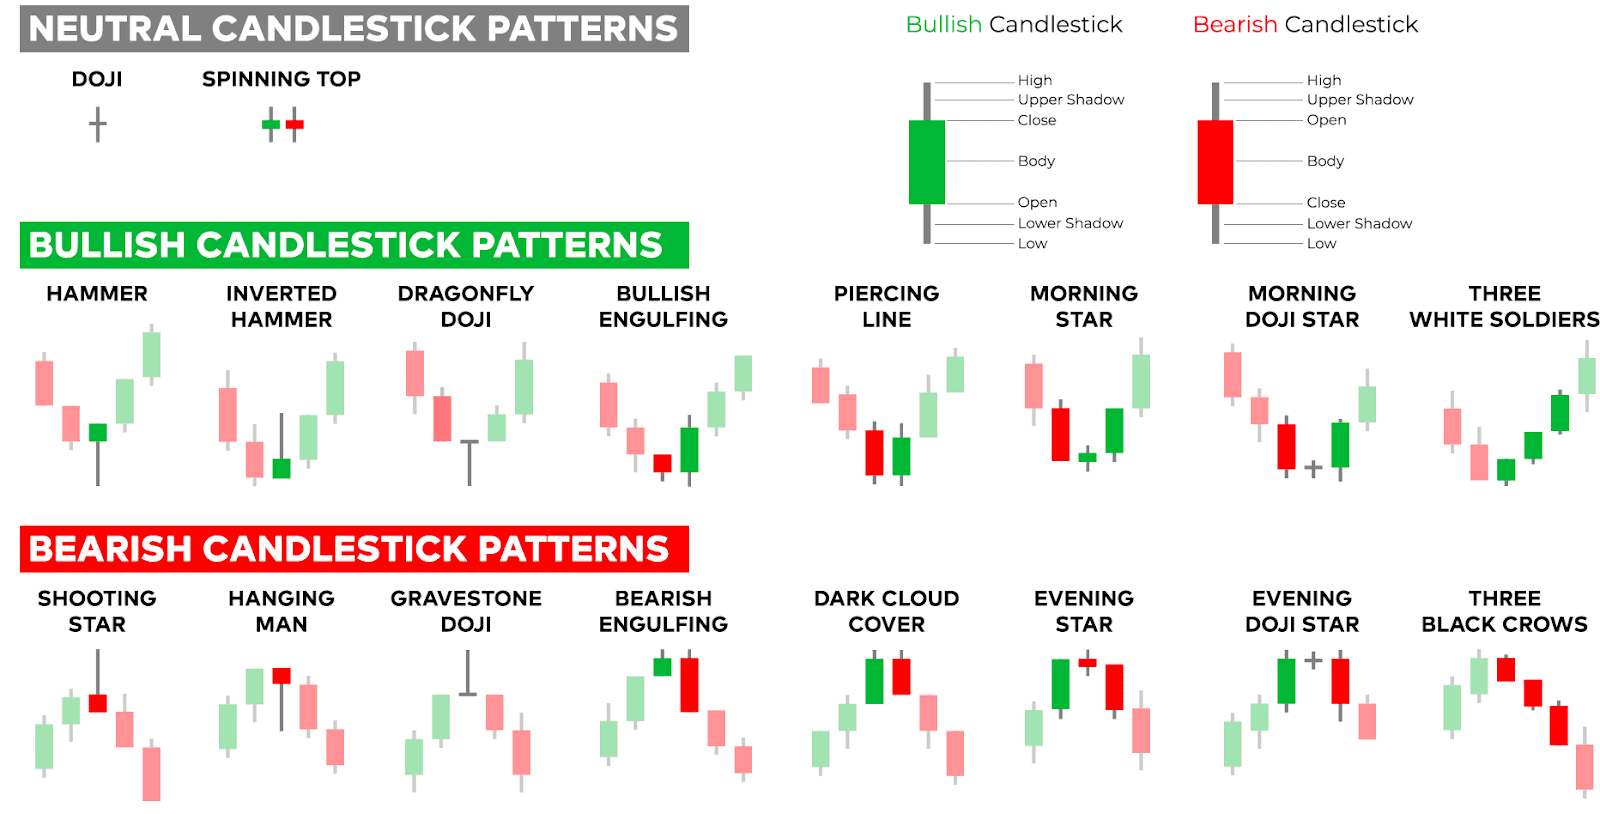
Above, we have described the basic and widespread candlestick structures, but in addition to the examples we have given, there are a very large number of other, lesser-known structures. You can see some of them in the picture below.
Secret approaches from BikoTrading
Sometimes traders decide to open a position only on the basis of candlestick structures, some traders generally build their own trading strategies based on candlestick analysis. In our case, candlestick analysis is an additional precondition for opening deals. Below we will show you some examples of how to achieve a higher percentage of profit and a lower percentage of losses.
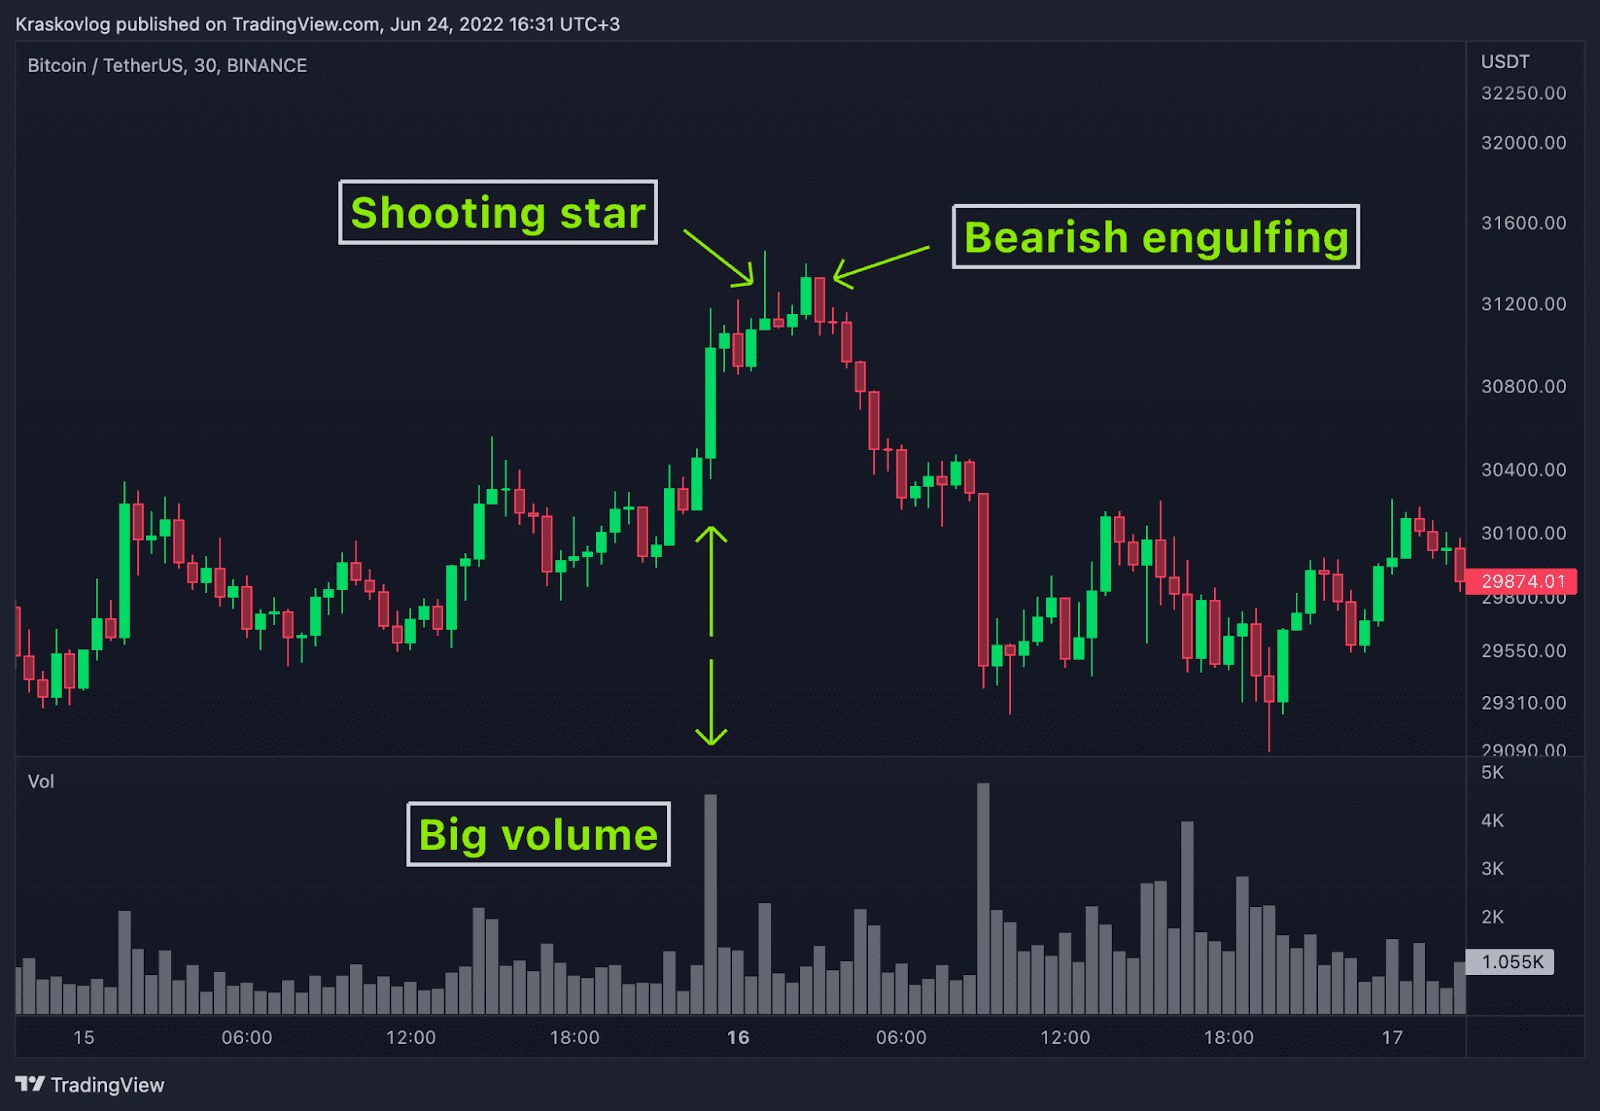
It is known that the price always moves from volume to volume. If the volume appears during growth, it is a signal that the big players are closing their positions, and it is worth preparing for a possible market reversal, and vice versa. Therefore, the combination of candle patterns and volume can be a very strong combination when opening a position.
The first example, combinations of candle patterns + large volume. The chart above shows that after the local upward trend, a large volume and two candlestick structures appeared at the top: a shooting star and a bearish engulfing. The appearance of two bear candle patterns together with the growth of the volume gives three times more probability that the price will turn in the other direction. So in this case, it was a good opportunity to open a short position and make money on falling prices.
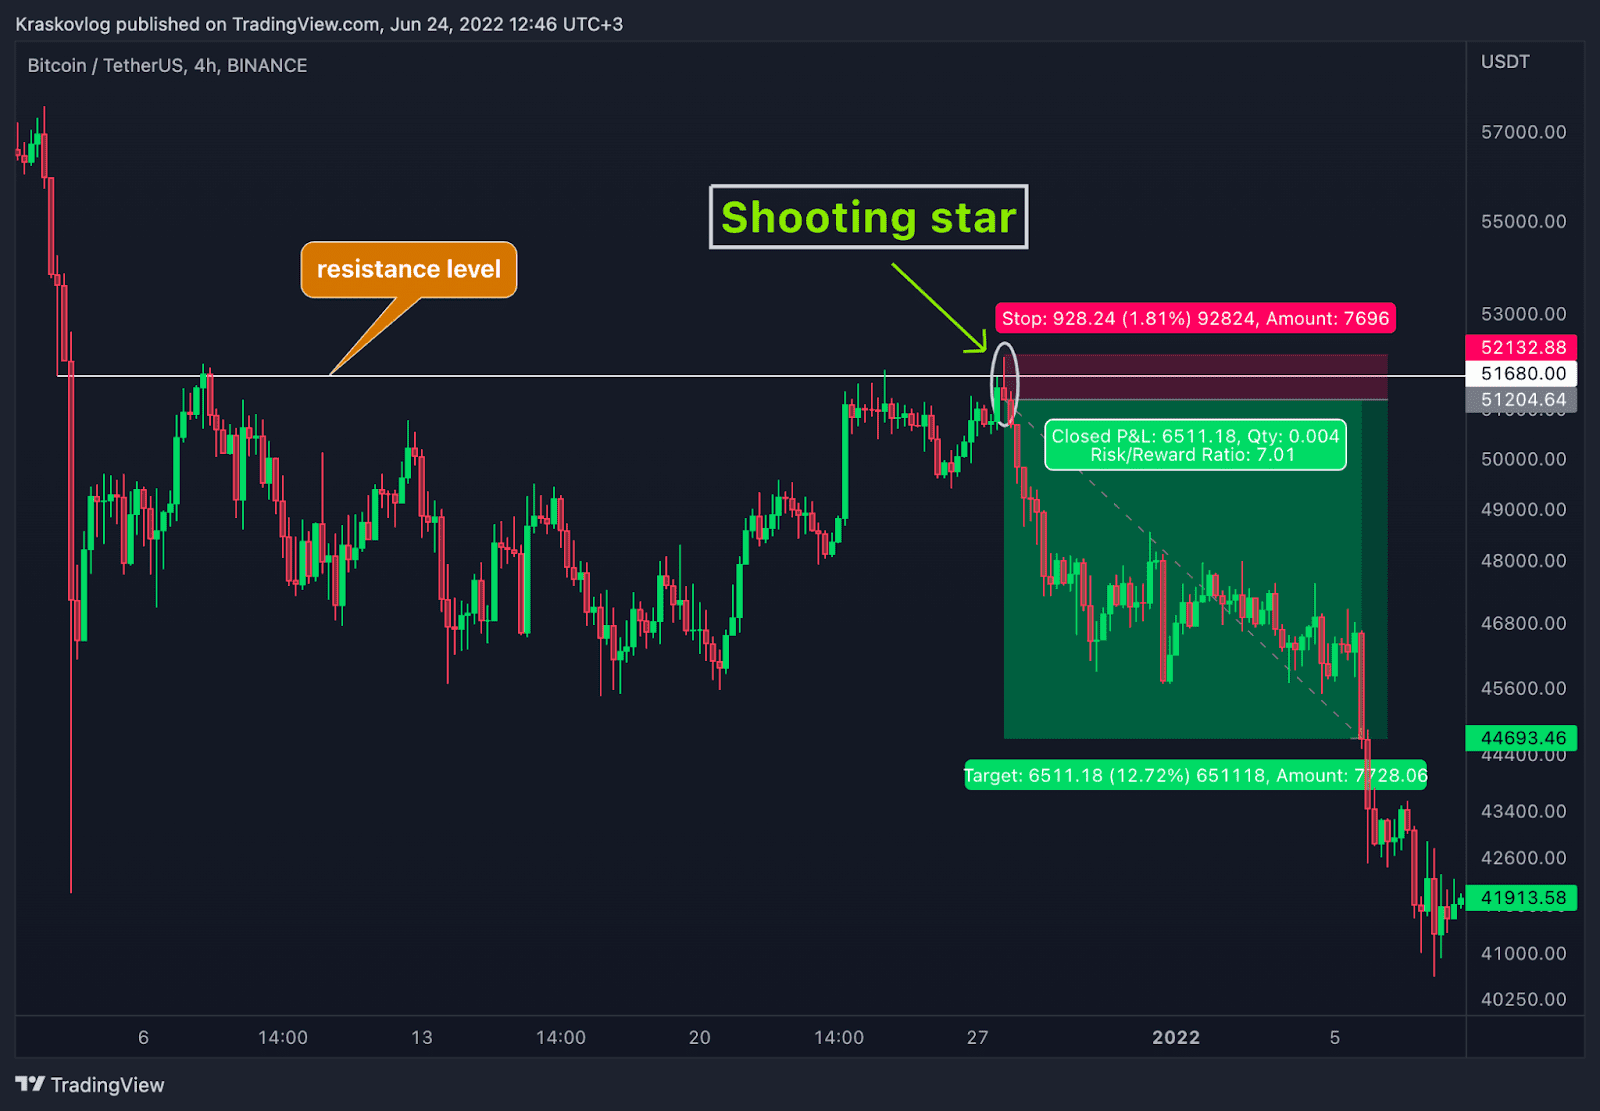
Our main strategies are level breakout and false level breakout. And in this case above, we see an example of how there was a false breakout of the resistance level, after which the candlestick structure of the shooting star was formed. As a result, the price immediately turned and went in a downward direction.
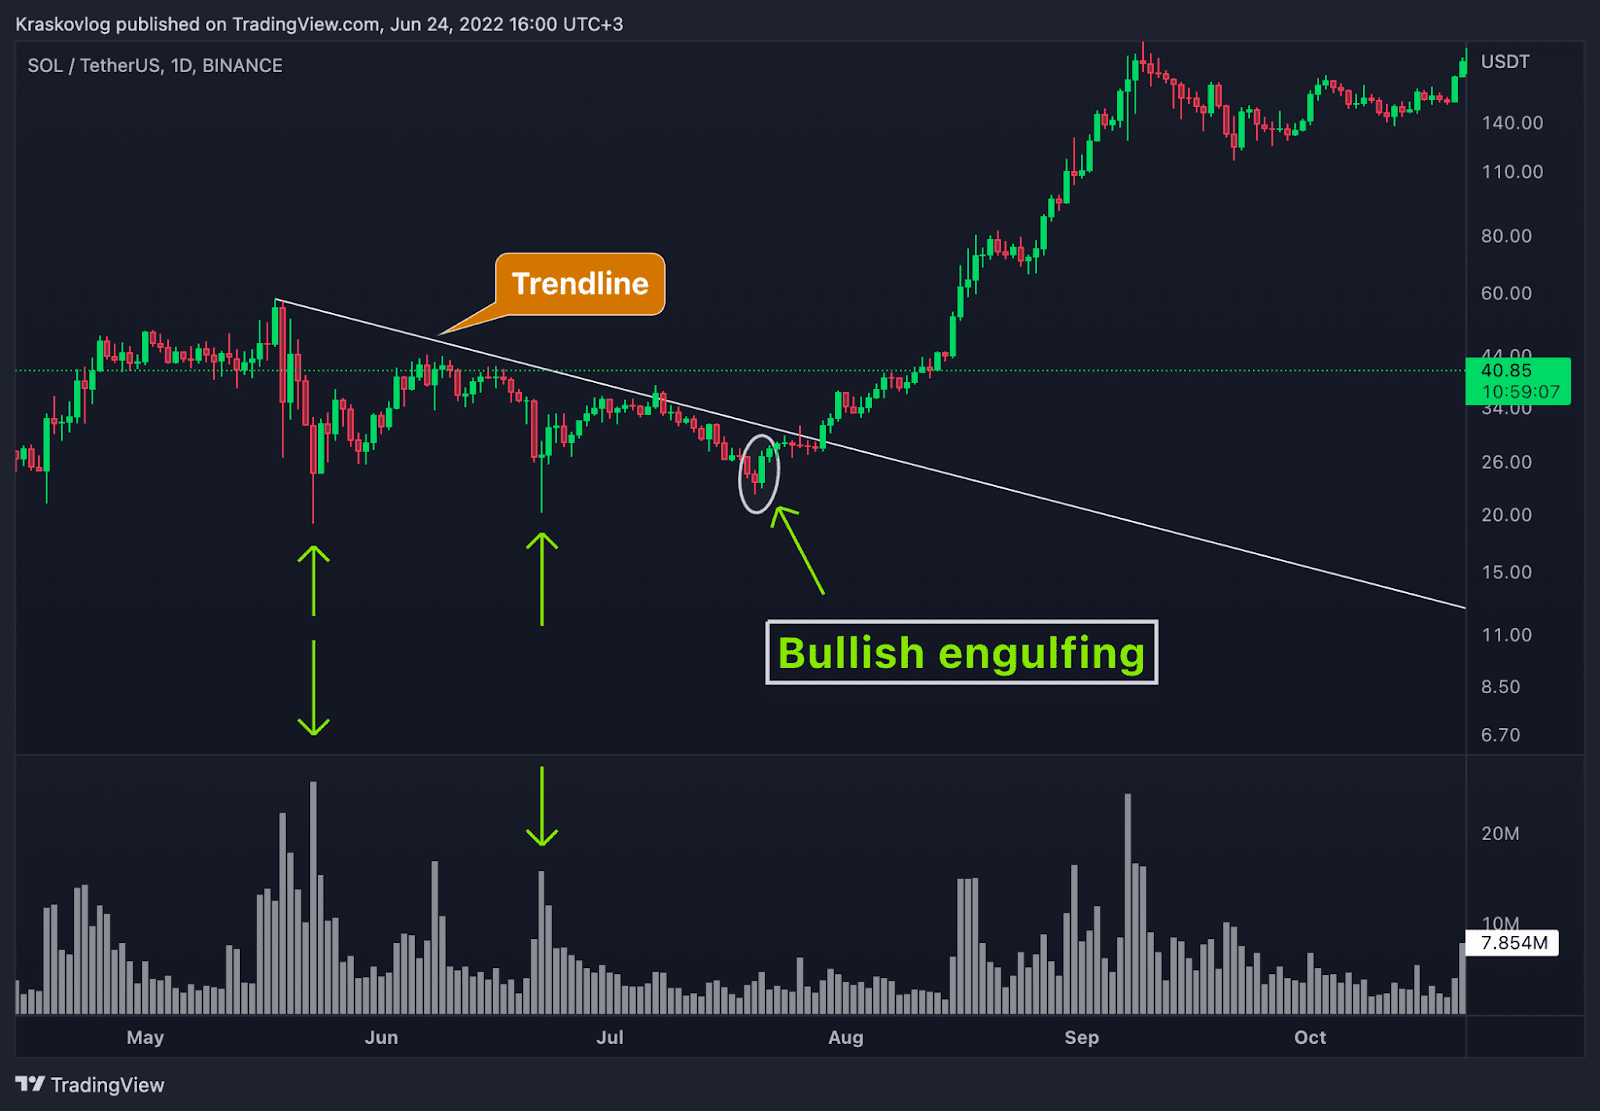
Another example of a breakout strategy combined with a large bottom volume and a bullish engulfing candlestick structure. As a result, a breakout and a strong rapid rise in prices.
Summary
Of course, candlestick analysis is one of the important parts of technical analysis, and can tell in great detail about the emotions and behavior of players. In our case, candlestick structures are an additional precondition for opening positions. By combining candle patterns, volume and breakout strategies and false breakouts, you can significantly increase the level of your trading results. We recommend that you add some of the patterns presented to your trading arsenal.


