Market Profile, TPO vs Volume Profile
By Yuriy Bishko Updated June 13, 2024
BikoTrading Academy
Market analysis provides valuable data about market structure, price directions, and potential price movements. Two popular methods widely used within market analysis are Time Price Opportunity (TPO) and Volume Profile. In this article, we'll explore these two approaches and show how to use them properly to make your trades more accurate.
KEY ISSUES:
What is Market Profile?
Market profile (or TPO) is a visual presentation of market data that shows price, volume, and time over a defined period. With market profile, trading strategies can be improved thanks to the analysis of support and resistance levels, preconditions, and profitable entry and exit points. Traders target market profile analysing the price structure and its changes.
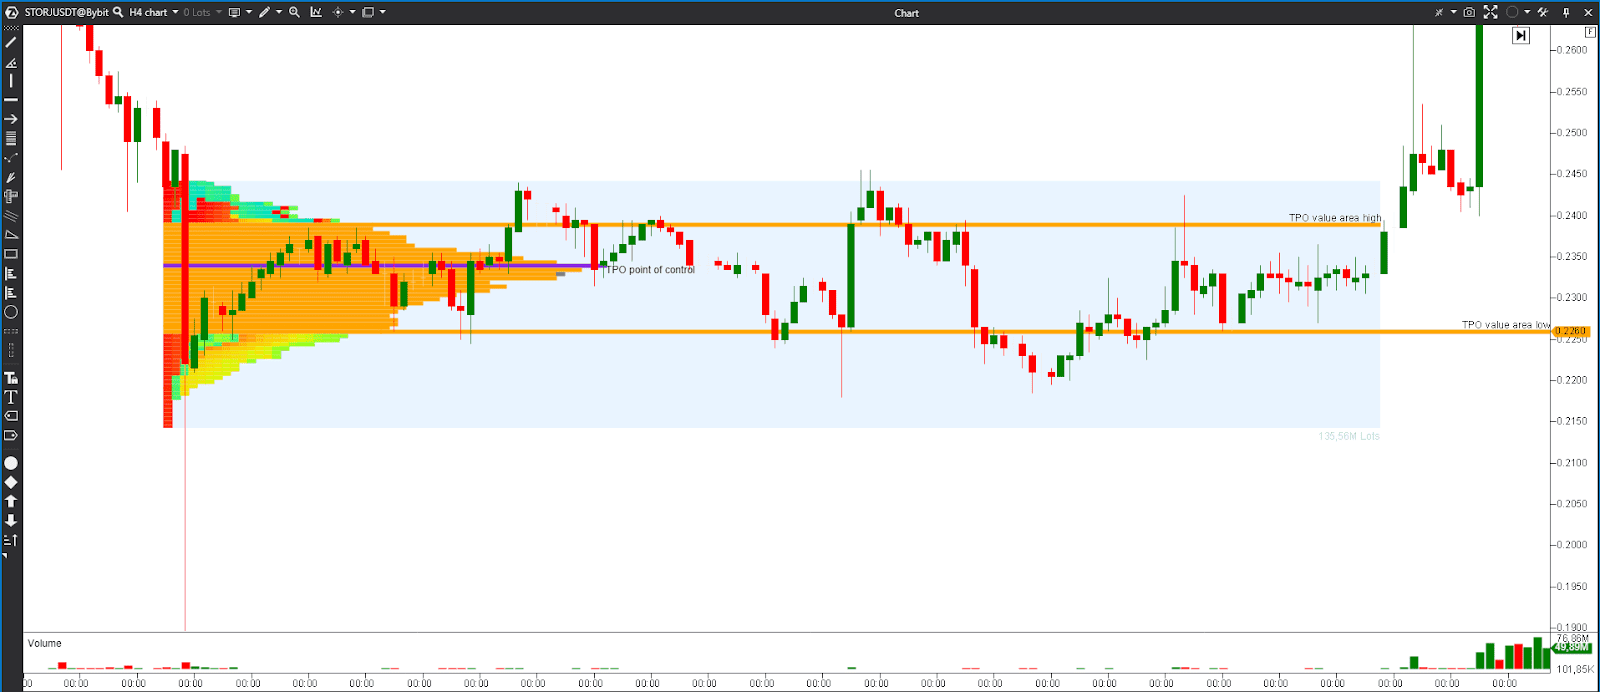
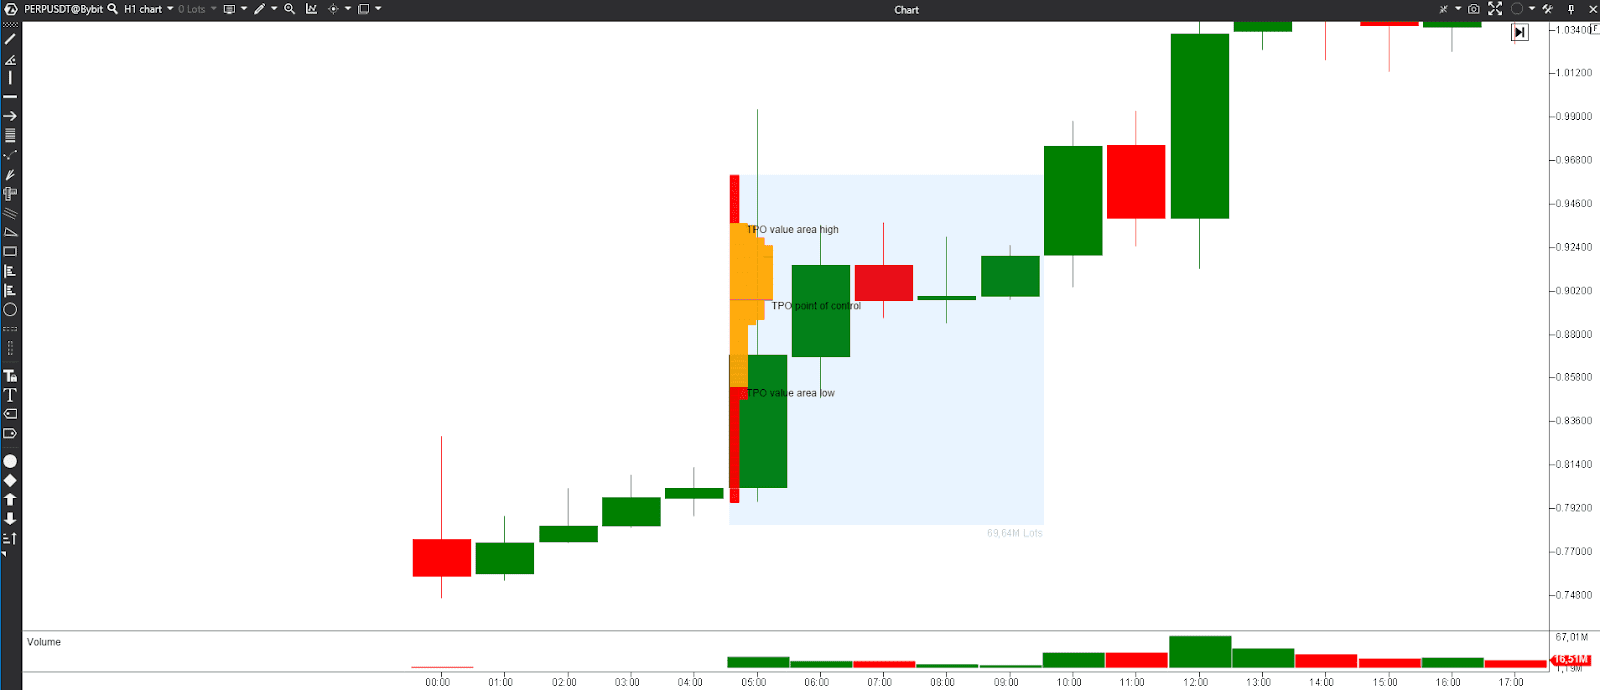
TPO charts, also known as Market Profile charts, are typically depicted as vertical bars, stacked horizontally, forming a histogram-like profile that indicates how much time the market has spent trading at different price levels during the chosen trading session or period.
Longer TPO bars mean that the market spent more time at that price, suggesting it's an area of price acceptance. Shorter TPO bars mean less time spent at a price level, indicating potential price rejection.
By the way, ATAS makes it super convenient to read TPO and Volume Profile charts and predict where the market is likely to go.
Key concepts in TPO analysis
Value Area. Market Profile analysis often focuses on identifying the Value Area. The Value Area typically encompasses around 70% of the total TPO bars.
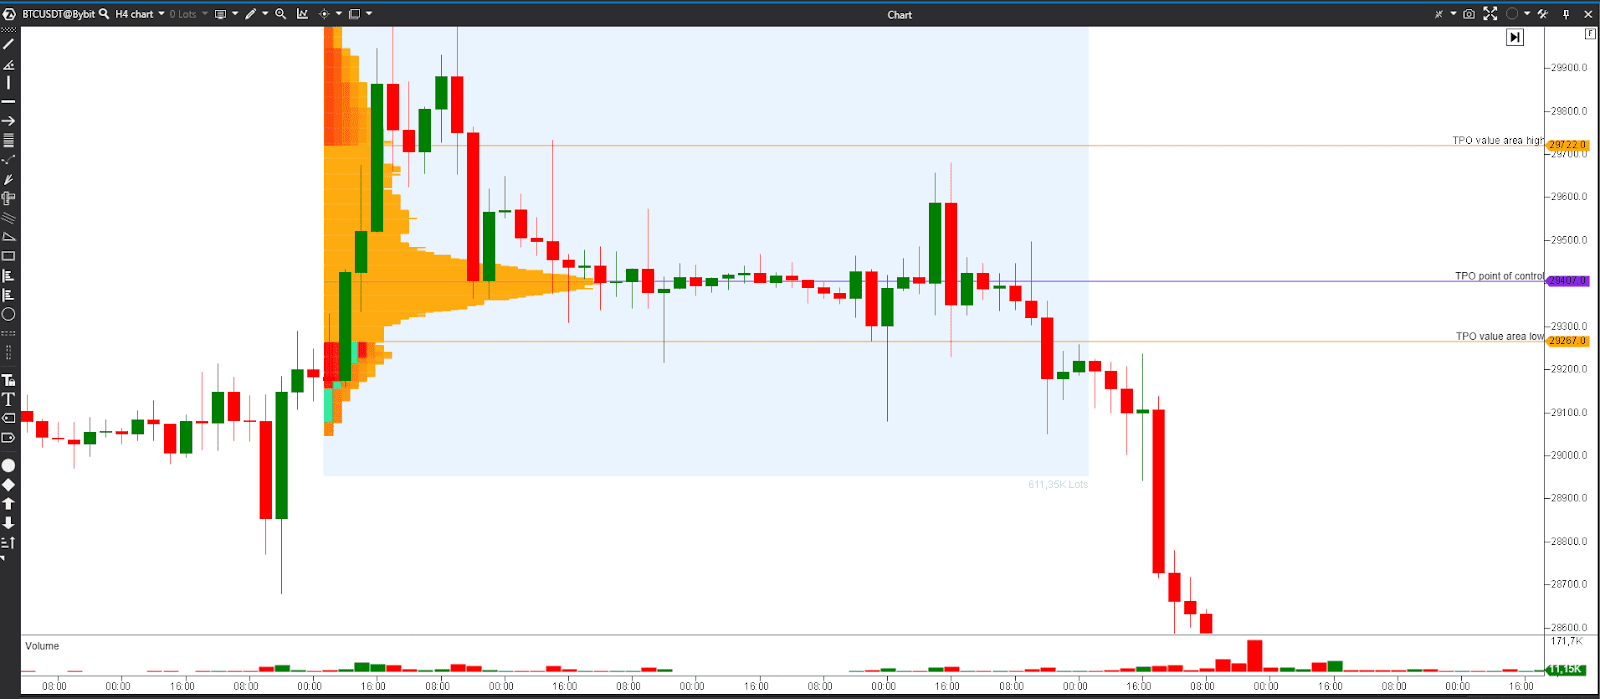
Point of Control. The POC is the level of the price that was the most popular during the trading session. It means the fairest price at which trading occurred.
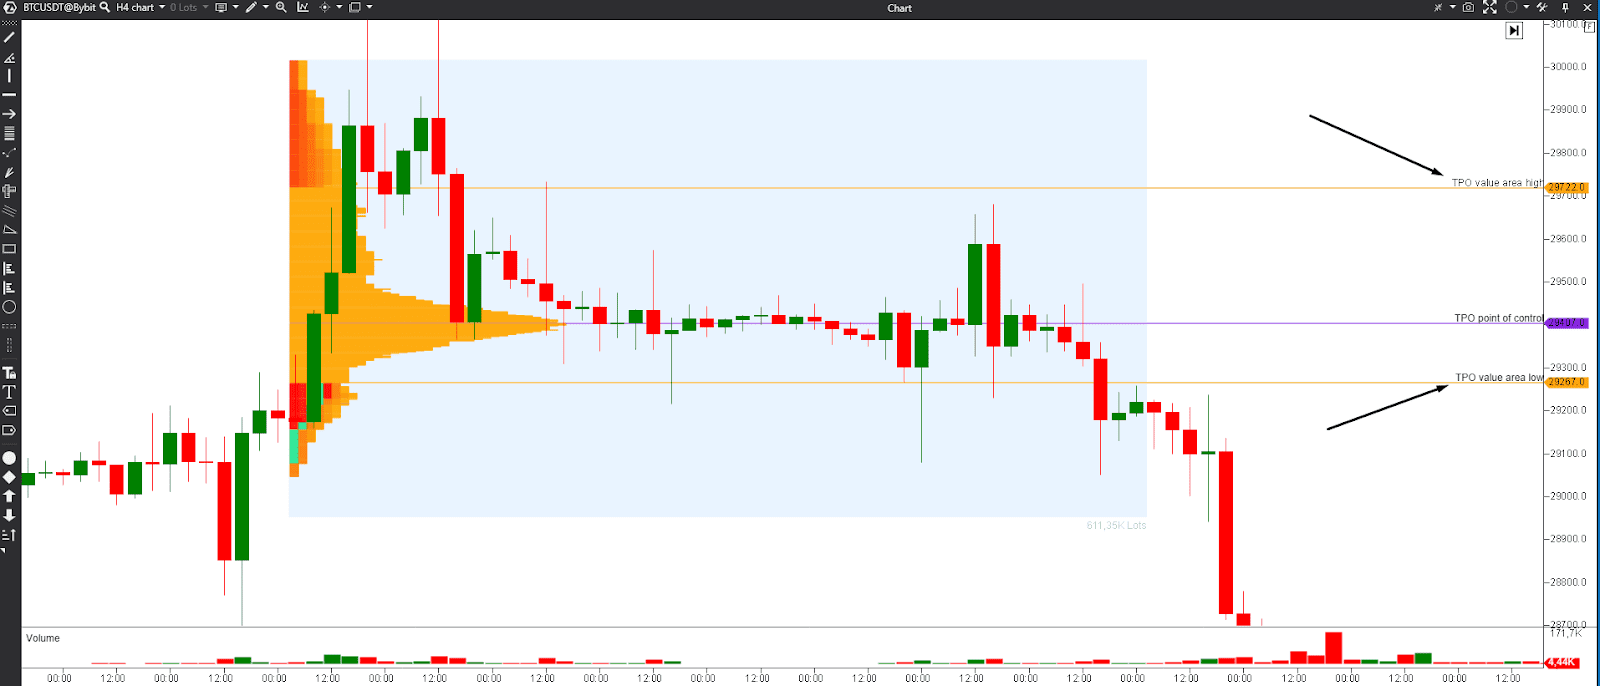
Developing vs. Established Value Area. TPO analysis distinguishes between the developing Value Area, which reflects the current trading session, and the established Value Area, which considers multiple sessions.
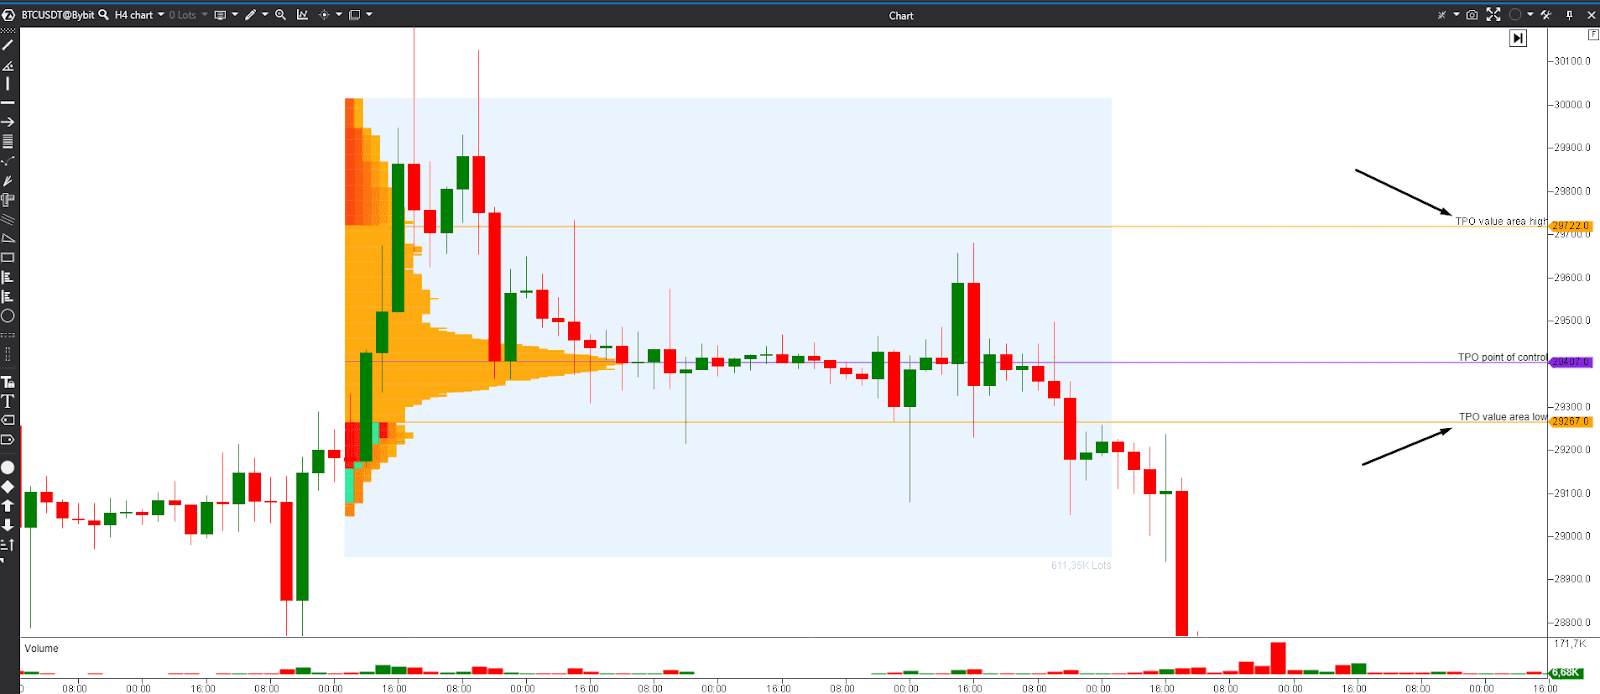
Advantages of TPO:
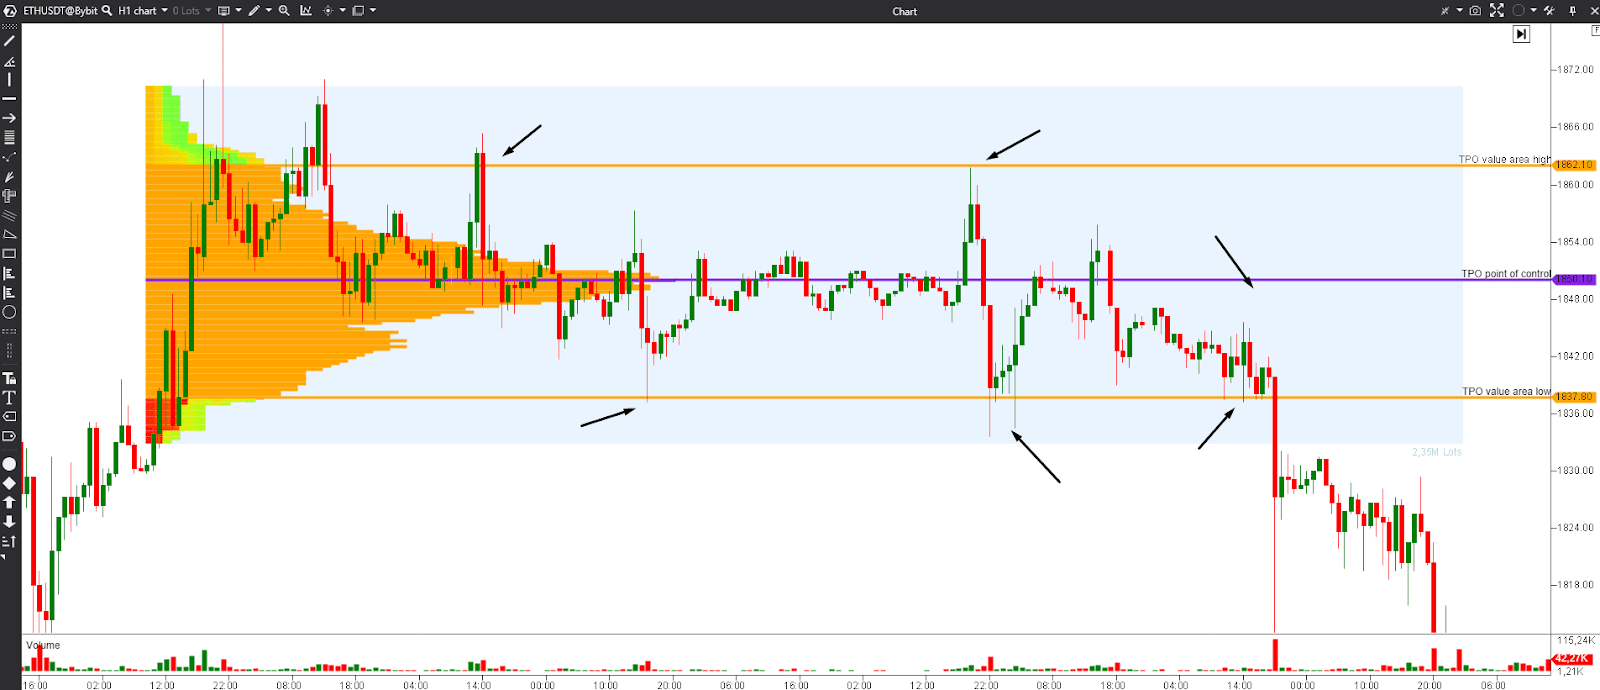
- TPO profile charts help to determine potential support and resistance levels. If a price level has a well-defined TPO profile with a long TPO bar, it suggests a strong area of interest.
- By examining TPO bars, you can predict the directions of the market movement. A skewed TPO market profile may indicate a bullish or bearish bias, helping traders align their strategies accordingly.
Volume Profile
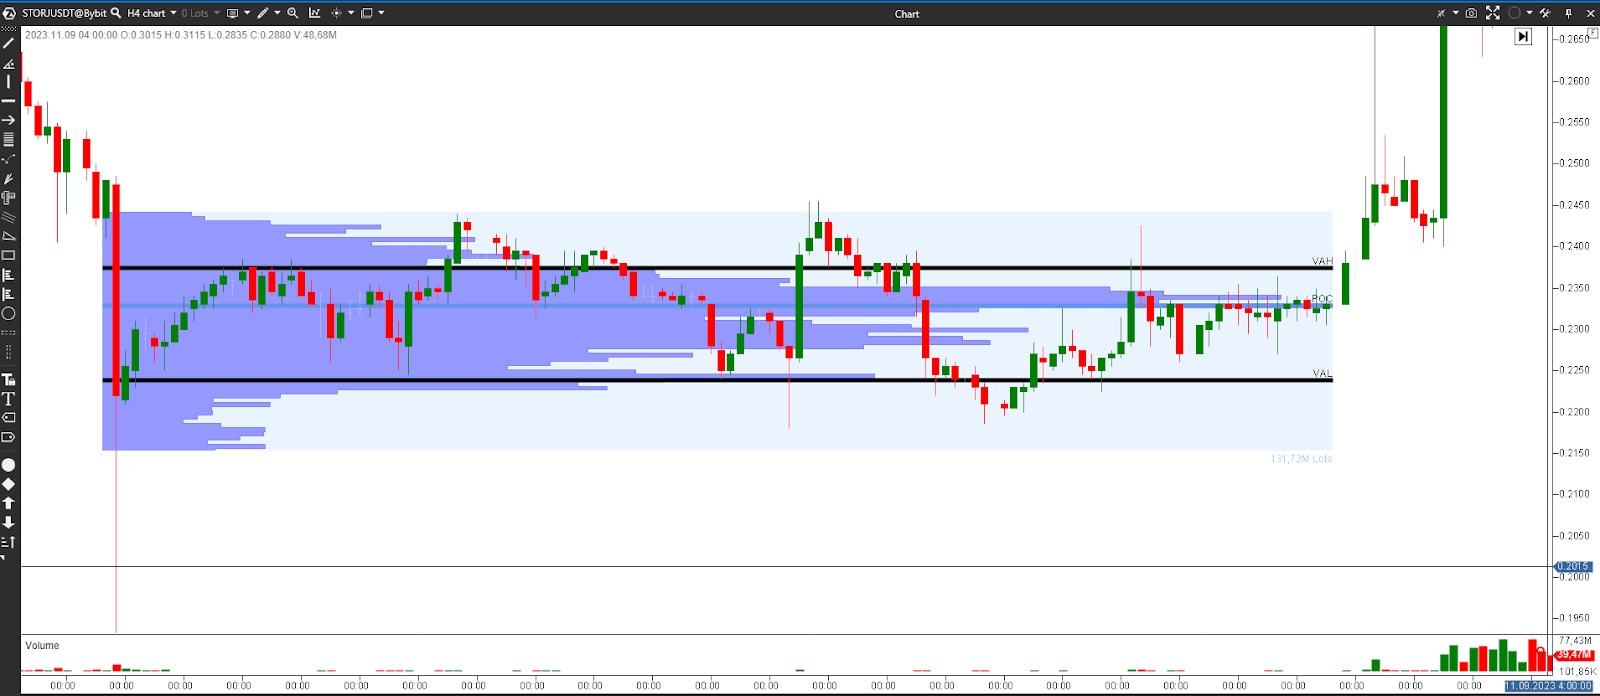
Volume Profile focuses on the spread of trading volume at different price levels during a defined time period. Trading with volume profile helps to identify significant support and resistance levels, and understand where trading activity has been concentrated.
Volume Profile charts are typically presented as a histogram or horizontal bars that run along the price axis. Each bar represents the trading volume that occurred at a specific price level.
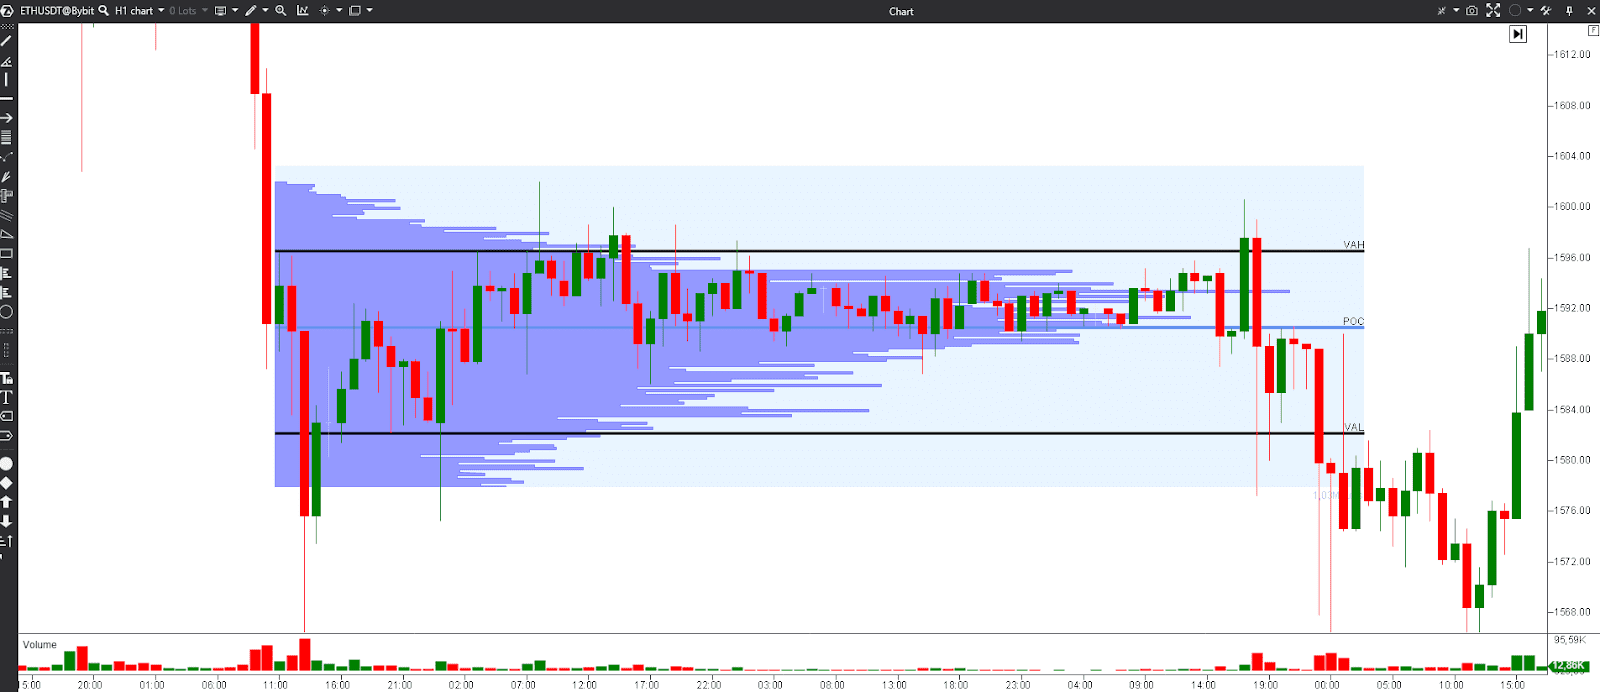
Key Concepts in Volume Profile analysis
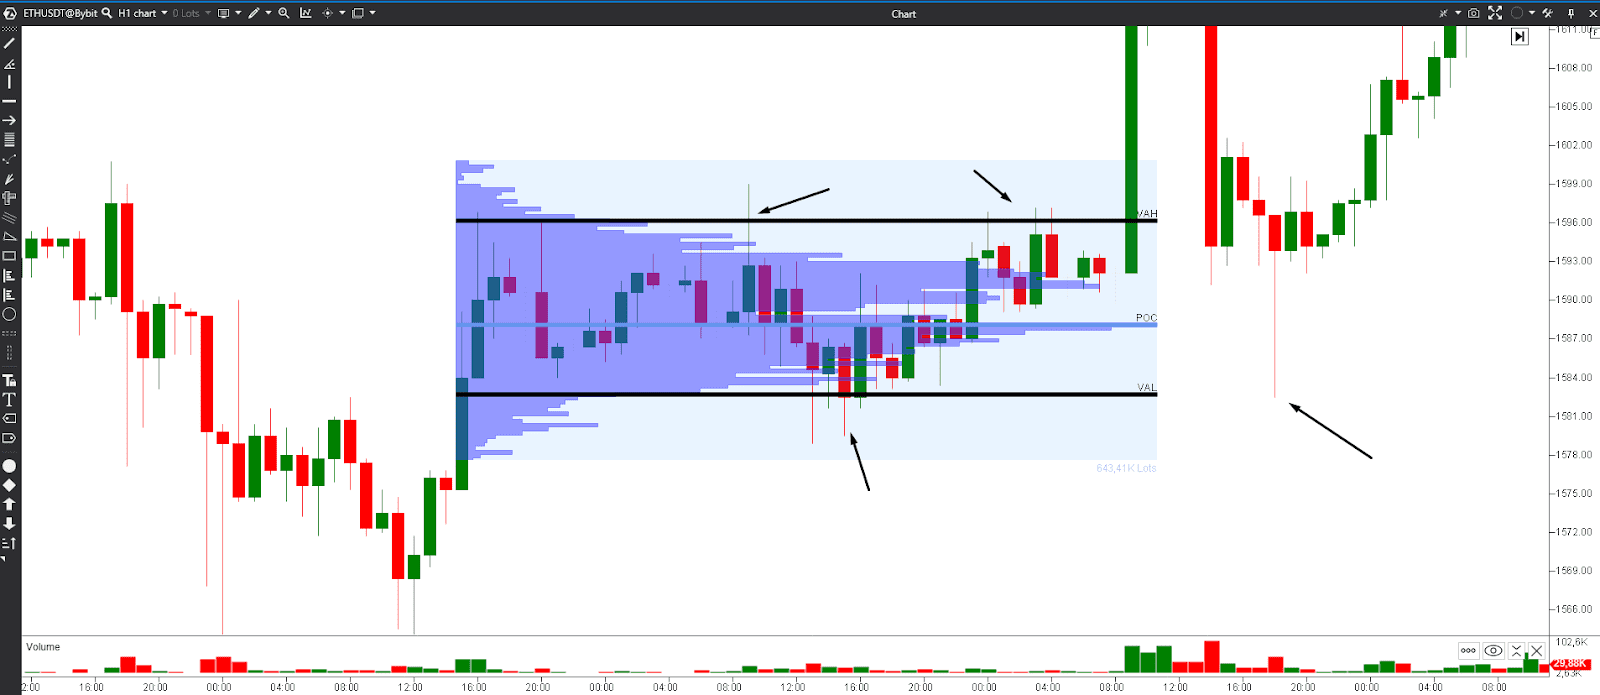
High-Volume Nodes. These are price levels where a significant amount of trading volume has occurred. HVNs are considered potential areas of strong support or resistance because they indicate intense trading interest. When using volume profile scalping strategies in crypto trading, it's essential to focus on high-volume nodes for precise entry and exit points.
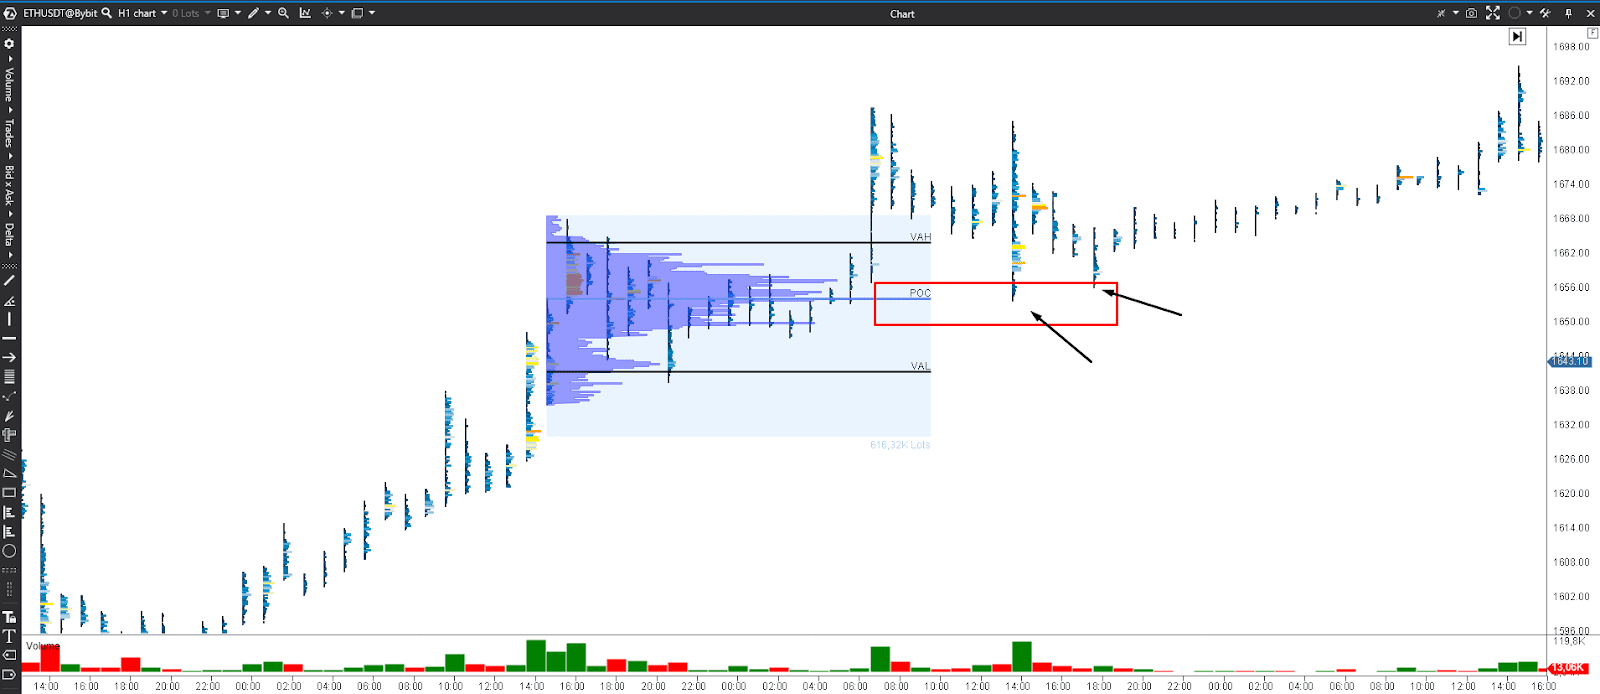
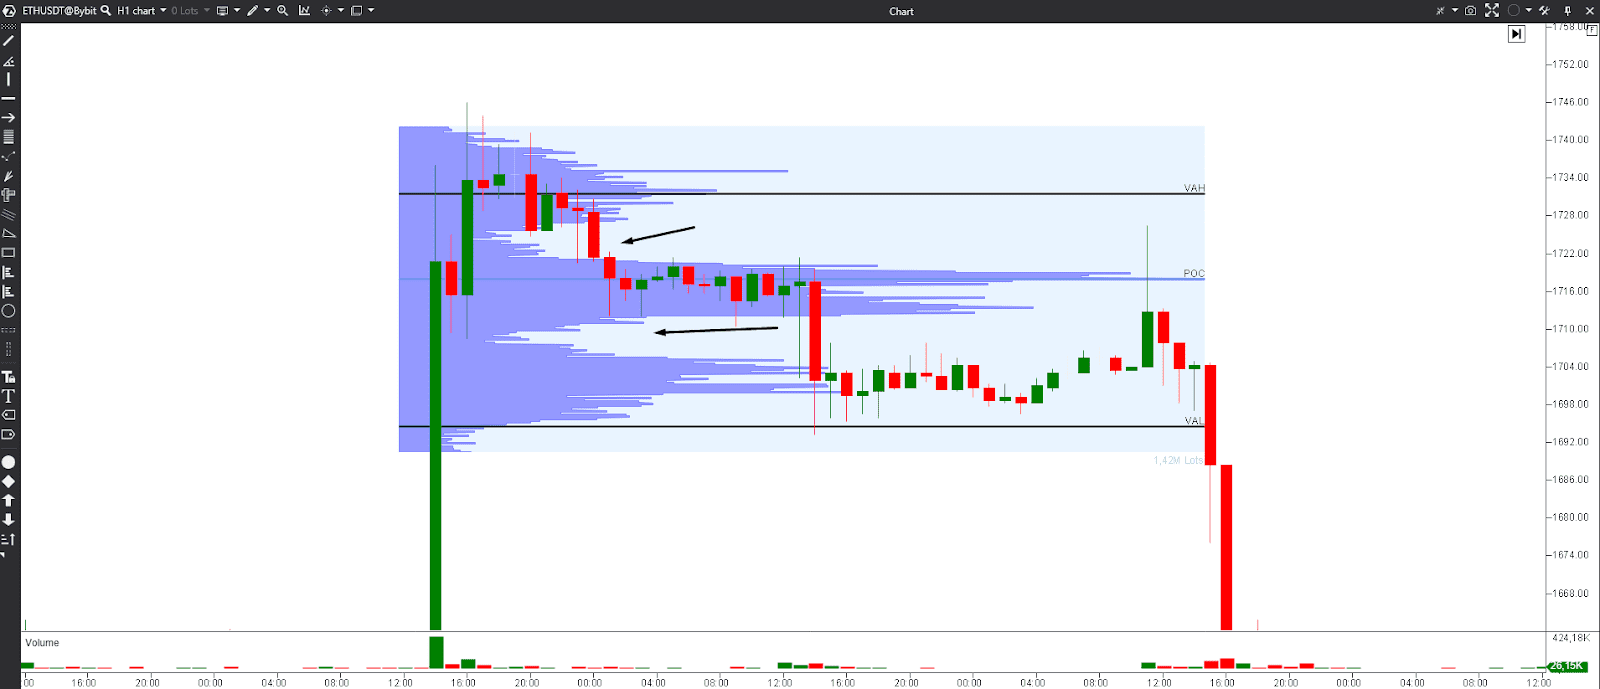
Low-Volume Nodes. These are price levels with relatively low trading volume. LVNs often represent areas where price can move more freely, as there may be fewer traders with vested interests in these levels.
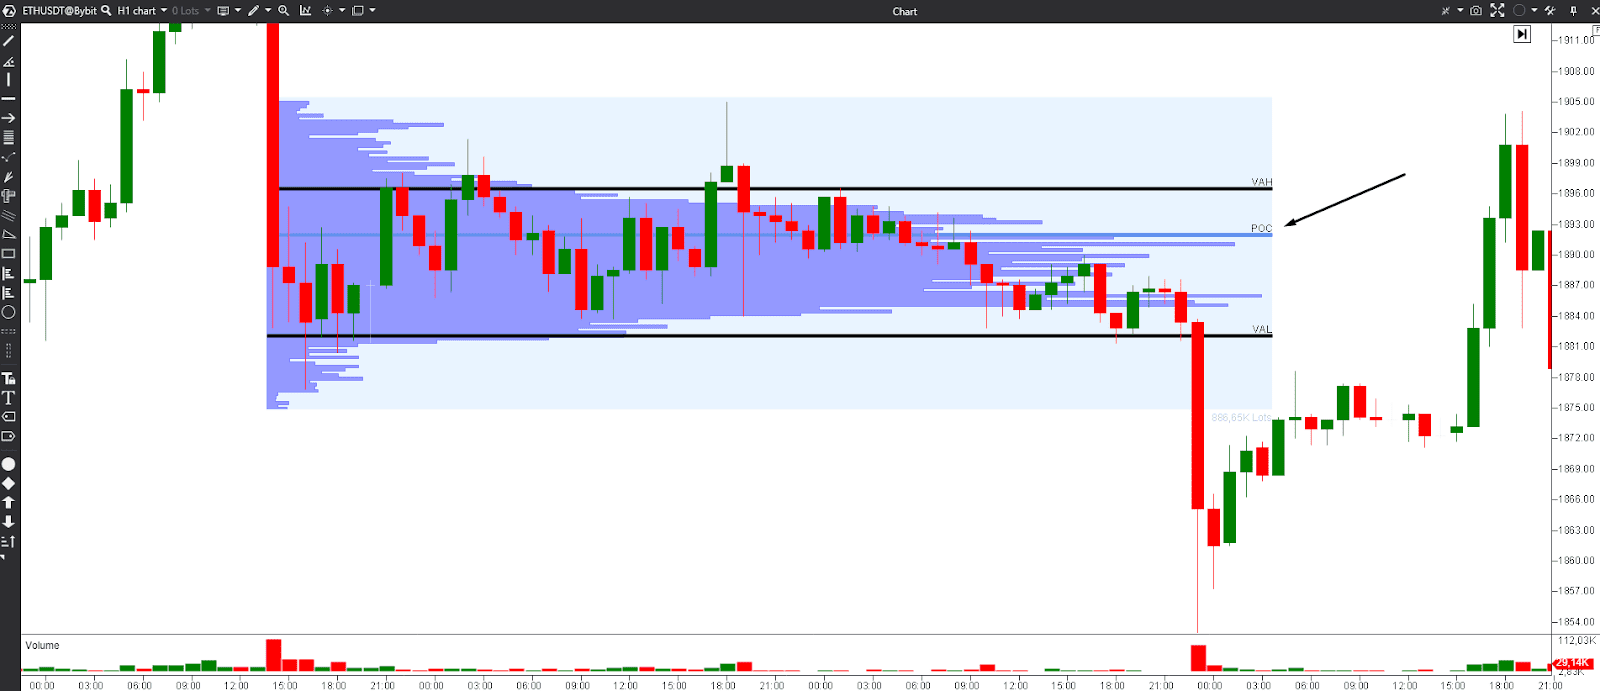
Point of Control. Similar to TPO analysis, the POC in Volume Profile identifies the price level with the highest traded volume. It is often seen as a critical reference point, indicating a fair price where most trading activity happens.
Learn more about how to use Volume Profile for day trading and combine it with TPO in our video
Advantages of Volume Profile analysis
- Volume Profile strategy shows the most interesting for traders areas. When used as an indicator, Volume Profile shows the concentration of trading volume at specific price levels.
- Volume Profile trading strategy can be used to confirm price breakouts. If the price breaks above or below a significant HVN with high volume, it can signal a strong trend continuation or reversal.
- When trading crypto Volume Profile is often used in conjunction with other technical analysis tools, such as moving averages, trendlines, and Fibonacci retracement levels, to strengthen trading decisions.
- When using volume profile indicators in your cryptocurrency trading strategy, it's essential to consider both short-term and long-term volume distribution. Traders can apply composite volume profile trading, a technique that involves combining and analyzing volume profiles from multiple timeframes.
Market Profile vs Volume Profile, what to choose?
Data focus
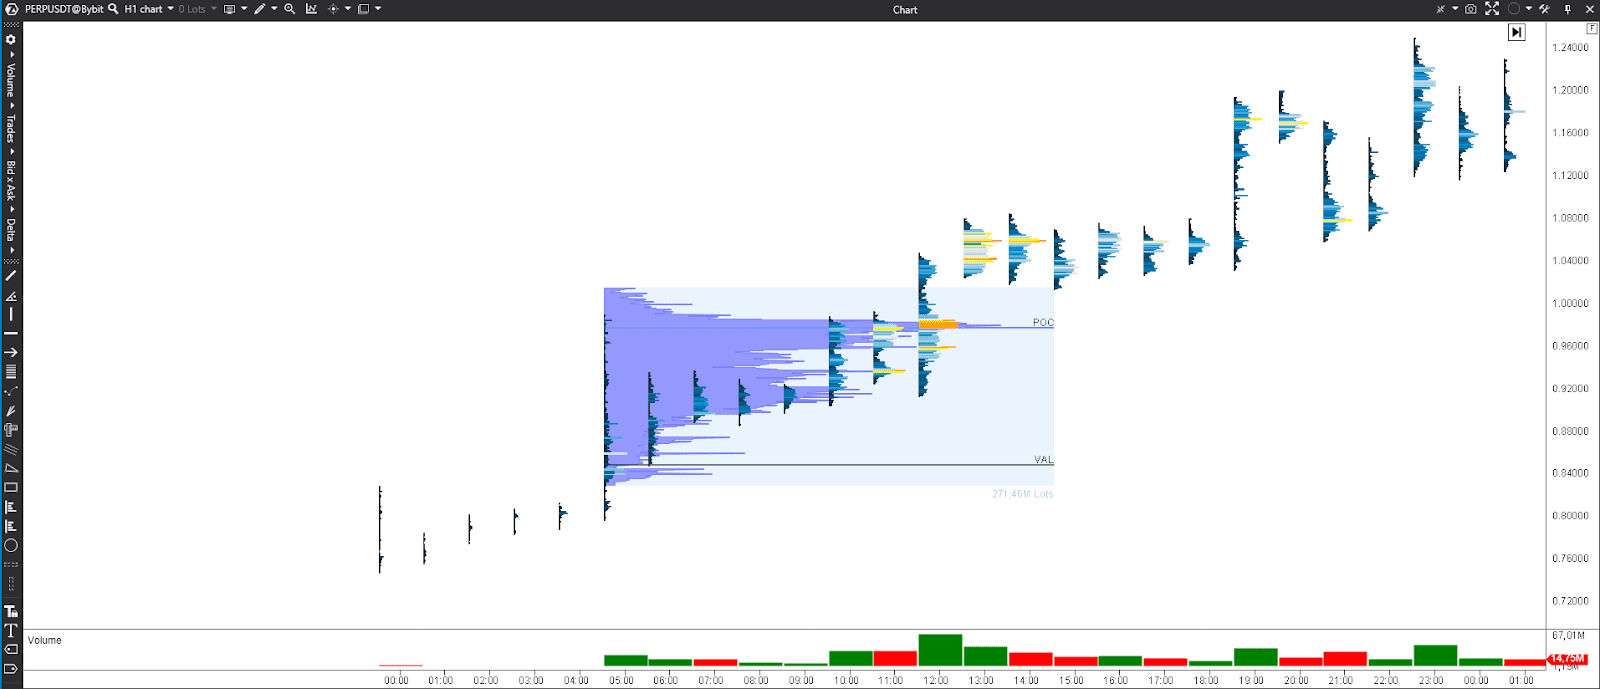
TPO focuses on time and price, making it useful for understanding how long the market spends at specific price levels. Compared with TPO, Volume Profile, as the name suggests, focuses on trading volume, revealing where significant buying and selling pressure has occurred.
Identifying support and resistance
TPO helps to identify areas of price acceptance and rejection, which can act as support and resistance levels. Volume Profile identifies support and resistance based on trading activity, with high-volume nodes being crucial areas.
Conclusion
In trading Market Profile and Volume Profile are necessary tools that help to understand the market's structure and dynamics. When comparing TPO Profile vs Volume Profile, traders get a full view of market dynamics. We recommend using both techniques to get a more comprehensive view of price changes and identify more efficient points to open and close positions.

