What is Footprint and how to read it?
By Yuriy Bishko Updated June 13, 2024
BikoTrading Academy
A Footprint in trading is a visual representation of trading activity and order flow for a particular financial instrument, usually displayed on a price chart. It gives an idea of the buying and selling pressure at different price levels and helps traders make more informed decisions.
KEY ISSUES:
What is Footprint in trading?
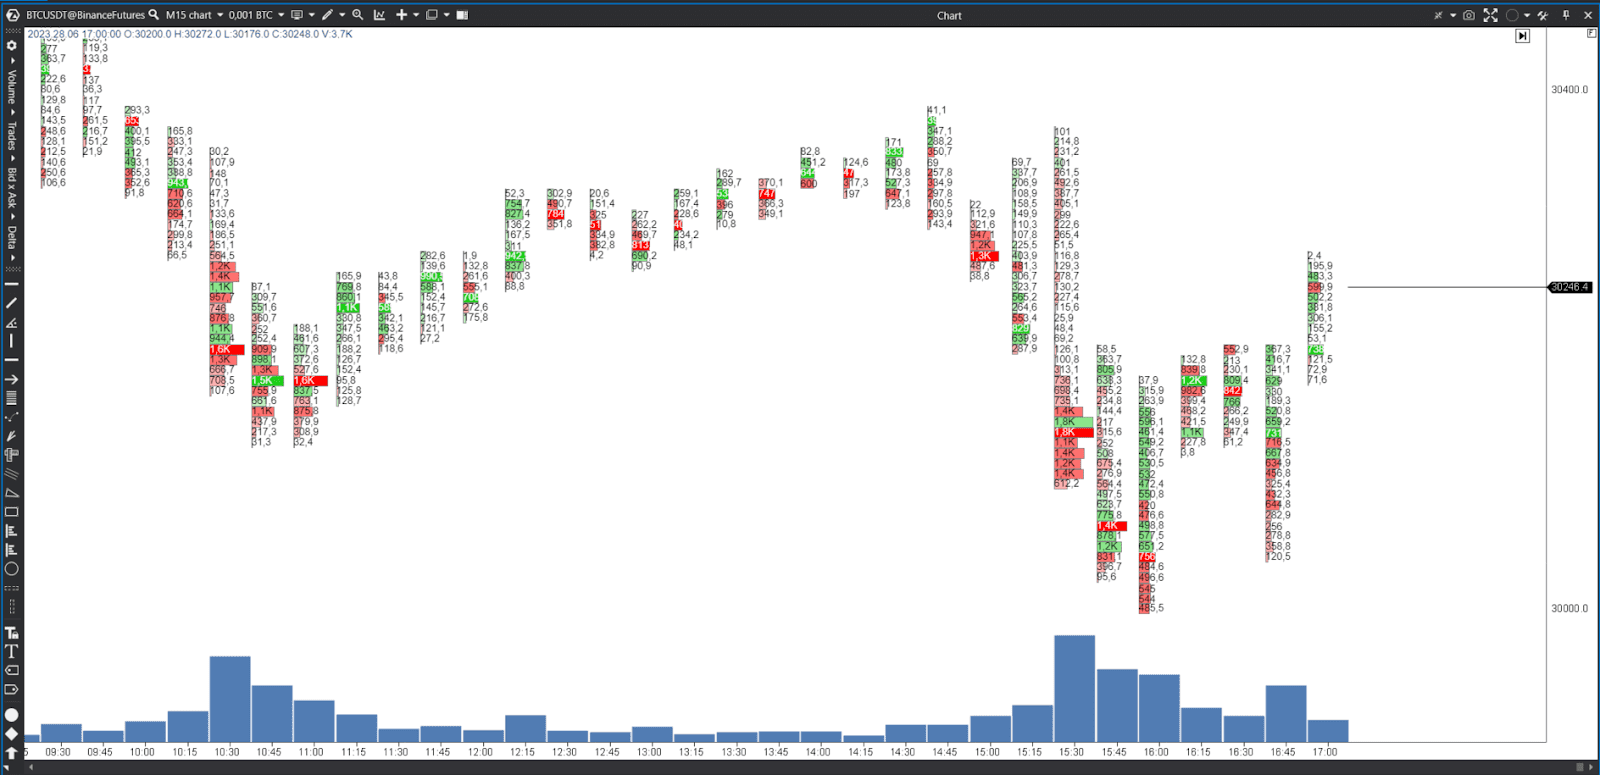
The Footprint indicator shows the "Footprints" of executed orders of a particular cryptocurrency. Reading a Footprint involves analyzing patterns, volumes, and price movements on a chart to understand market dynamics and potential trading opportunities. Traders examine the intensity of buying or selling at certain price levels, the presence of large institutional orders, and the speed at which prices change. Having understood what Footprint is, you can quickly identify support and resistance levels, potential reversals, or trend strength.
Where is Footprint used, and on which platforms to look for it?
Footprint analysis, also known as order flow analysis, is a popular technique used by traders in various financial markets. Here are some of the most common trading platforms that support Footprint analysis:
- The ATAS trading platform, which we use extensively, provides Footprint charts along with other order flow indicators. Traders can analyze the market depth and volume dynamics to improve their trading strategies.
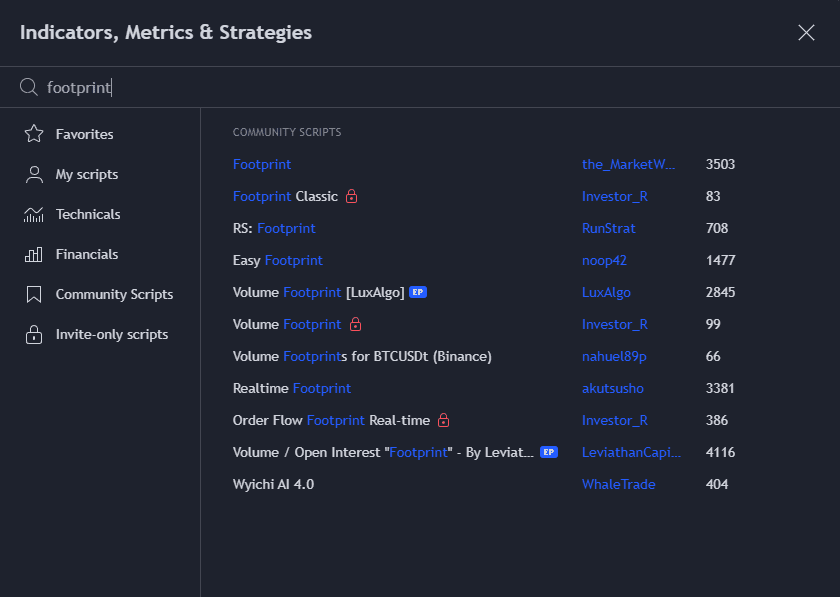
- TradingView offers a wide range of technical analysis tools, including Footprint charts. Traders can analyze the flow of orders with the help of TradingView's extensive library of indicators.
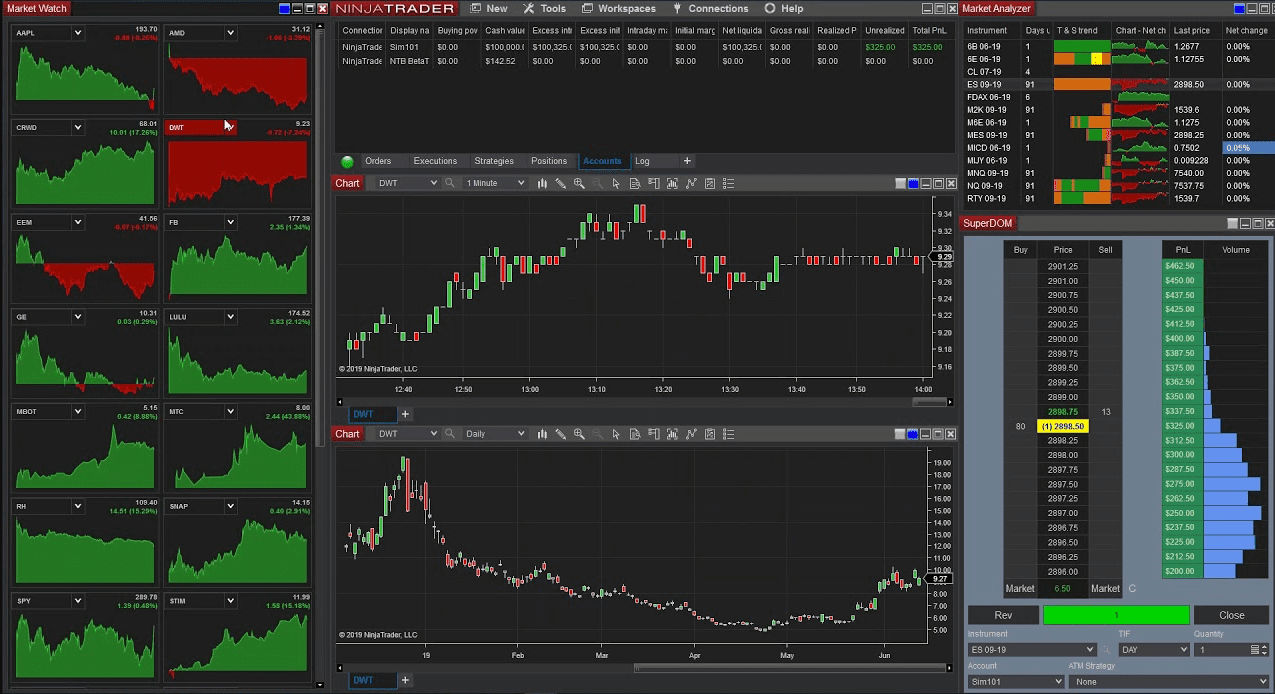
- NinjaTrader is a popular trading platform that offers advanced charting capabilities. Traders can profile the volume and order flow data to read market dynamics.
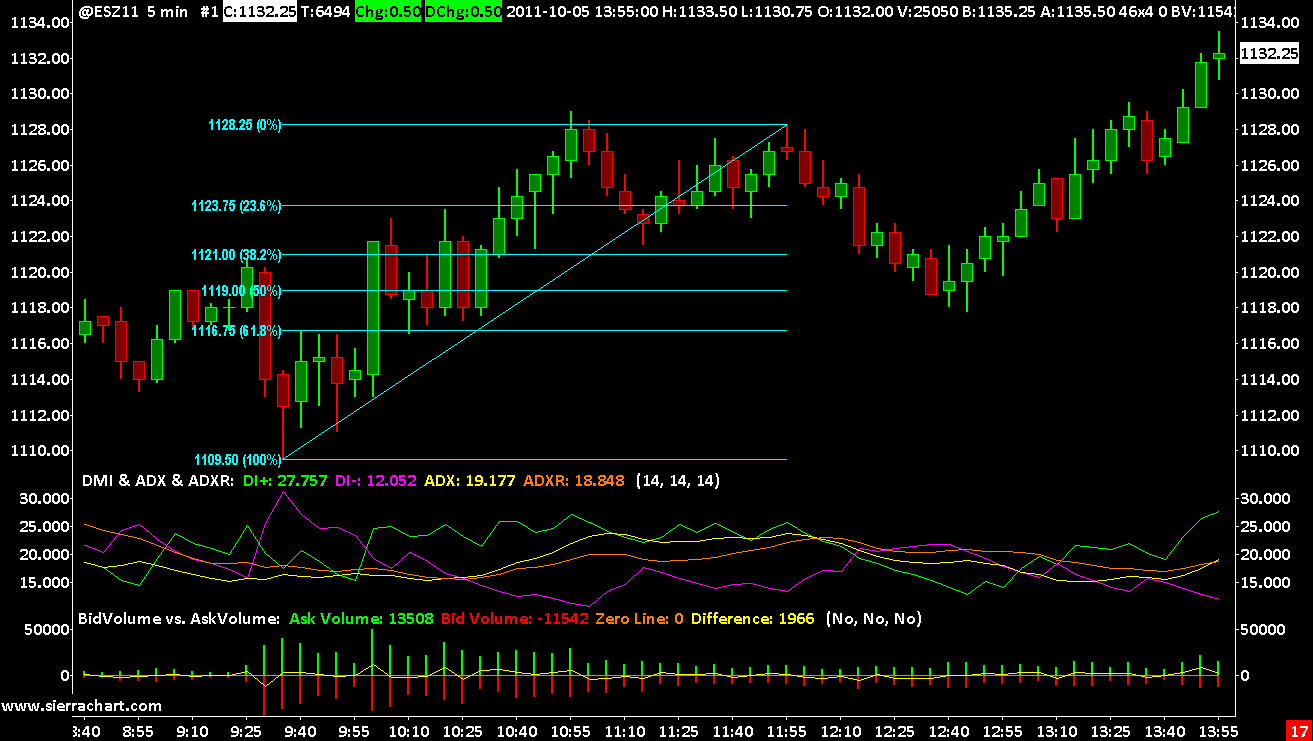
- Sierra Chartis another popular platform that provides functionality for building Footprint charts.
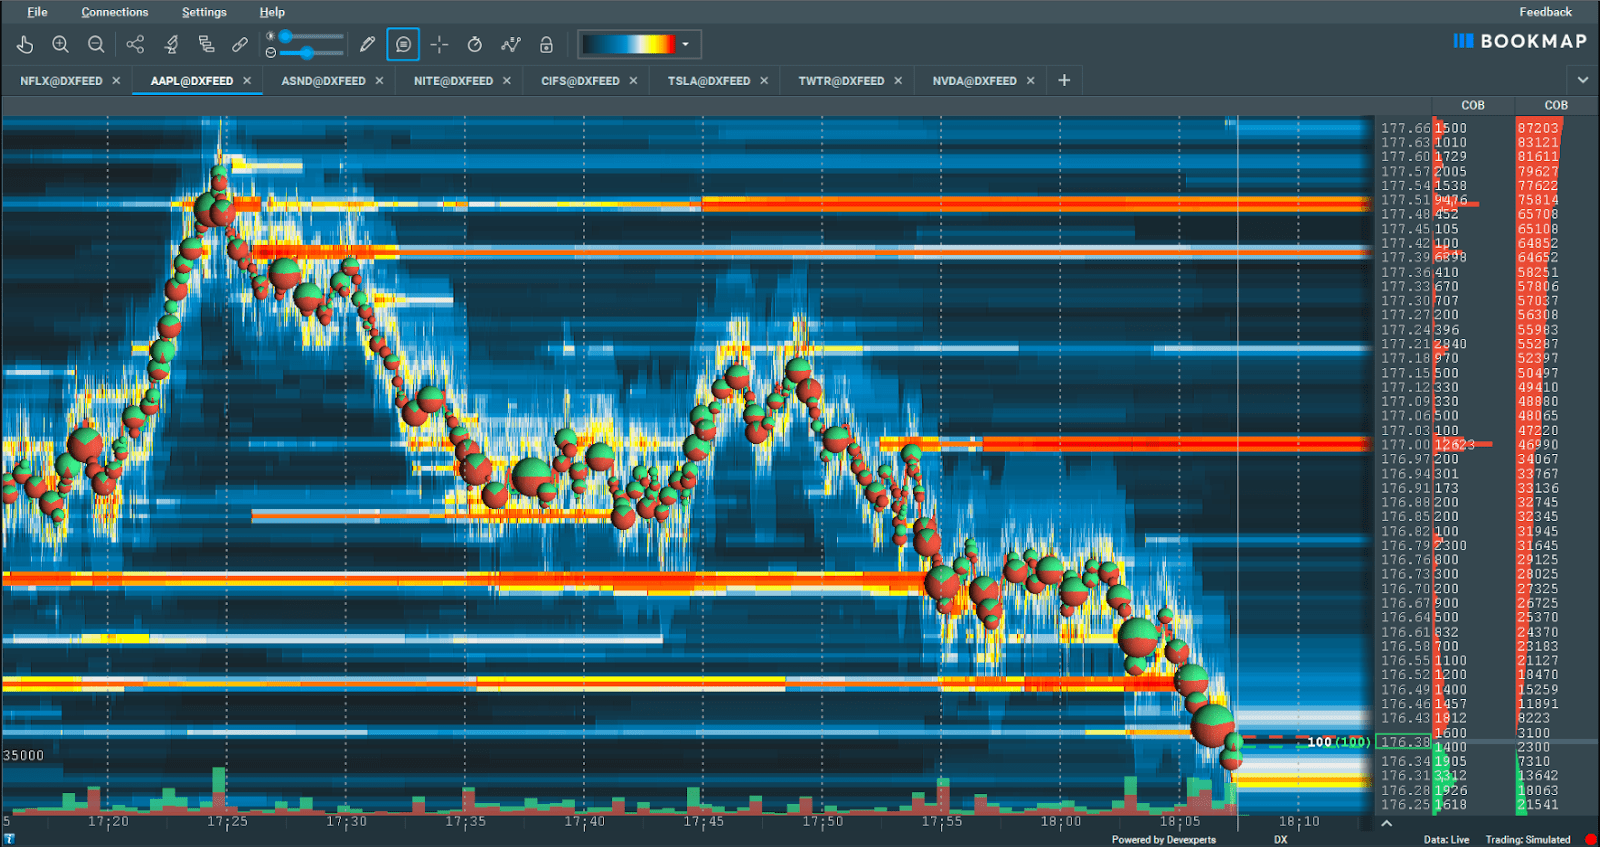
- Bookmap is also widely used to analyze Footprint in the crypto market. It provides visualization of order flow, giving traders an idea of liquidity and market sentiment.
How to read Footprint?
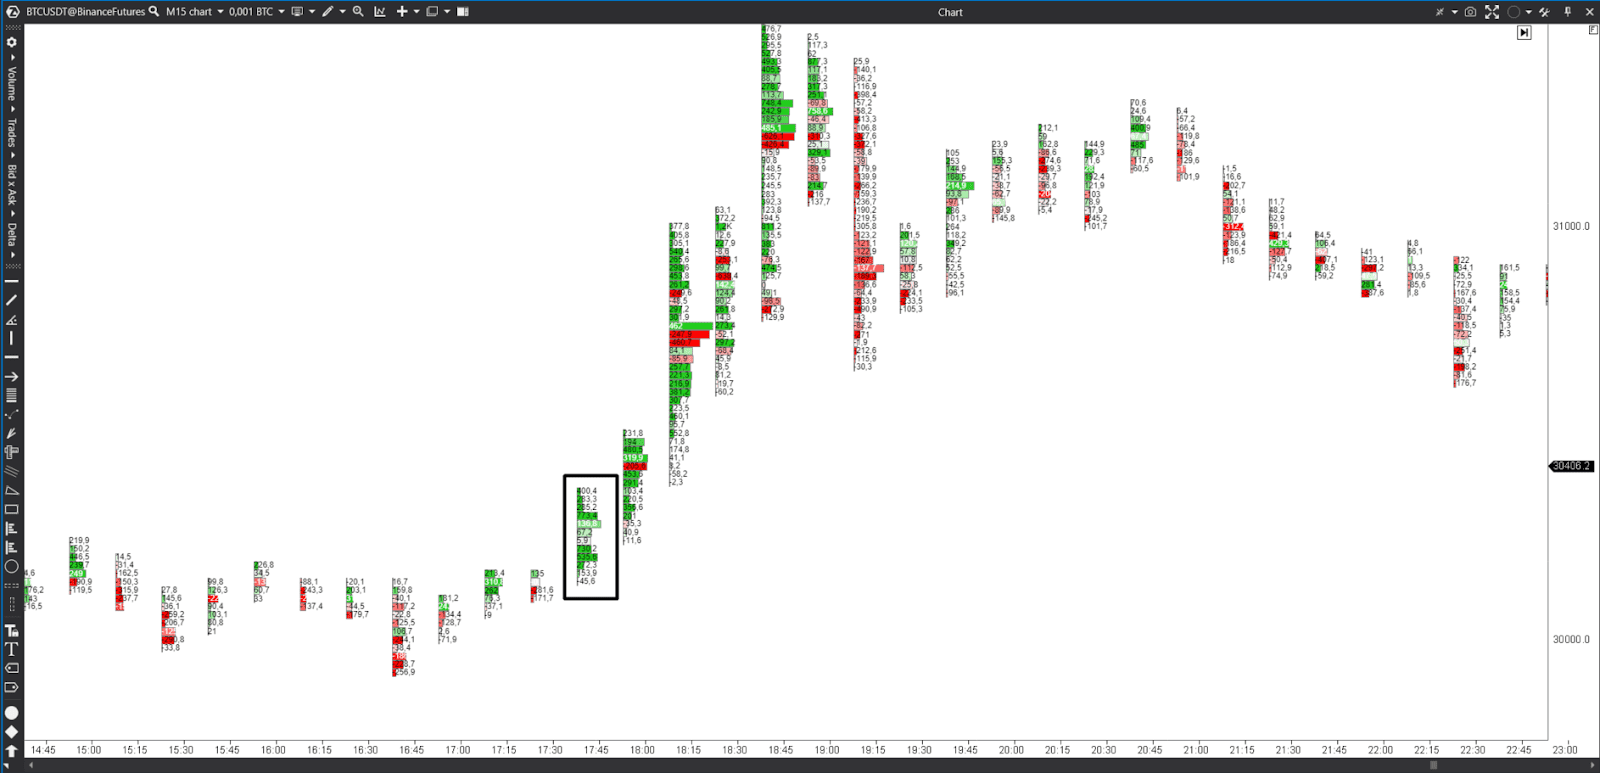
There are several types of Footprint, let's consider the most important ones: Volume Profile, delta, and Bid&Ask indicator.
Volume Profile
The Volume Profile helps to identify areas of high trading activity, indicating significant support and resistance levels. To identify areas where traders are most active, we look for price levels with the highest volume. These levels can act as potential entry or exit points, as prices are more likely to reverse or consolidate around these areas.
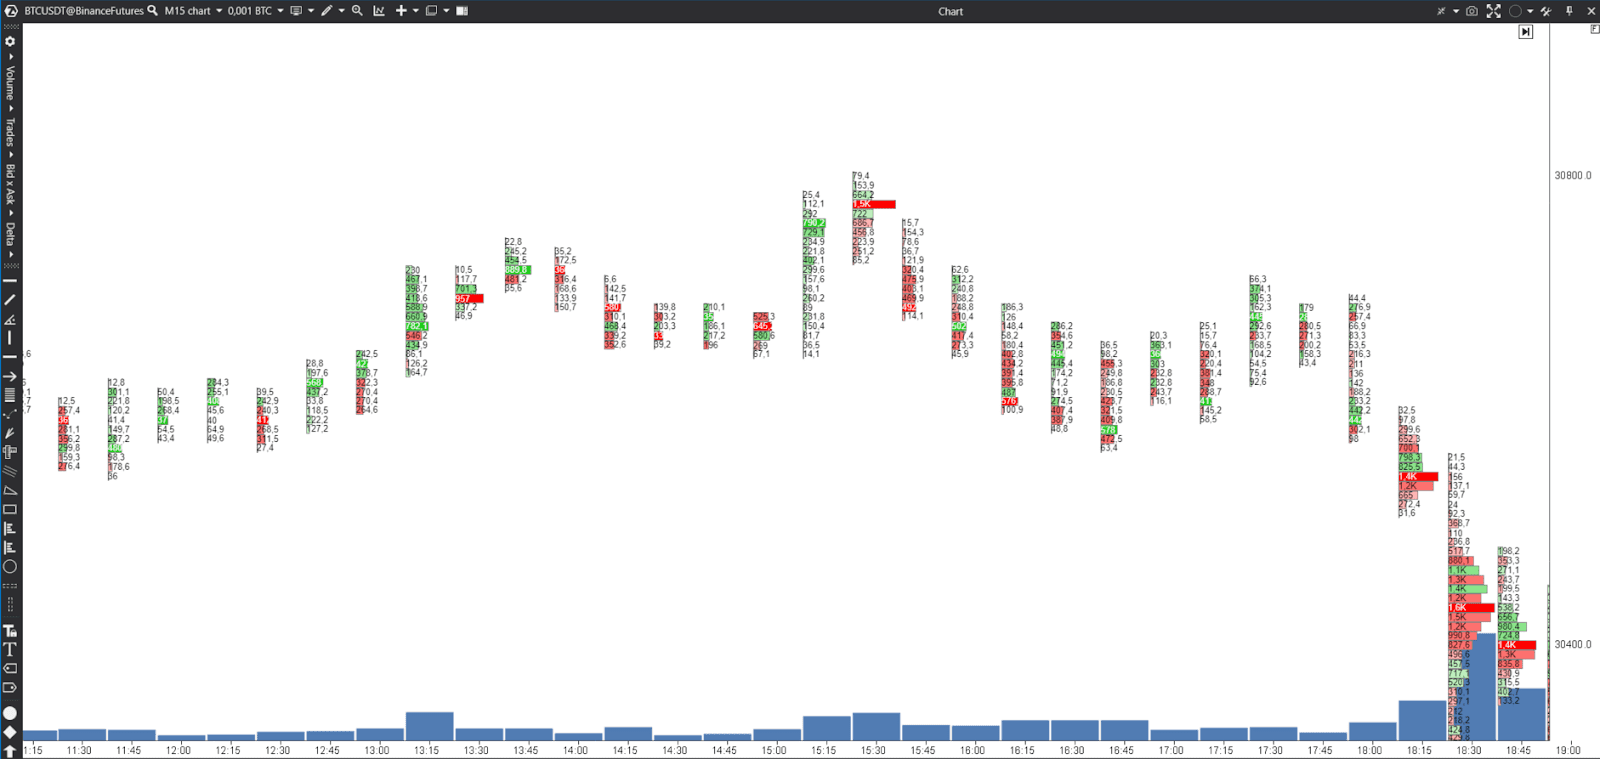
The cell will be green if the buy volume exceeds the sell volume. Conversely, it will be red if the sell volume exceeds the buy volume.
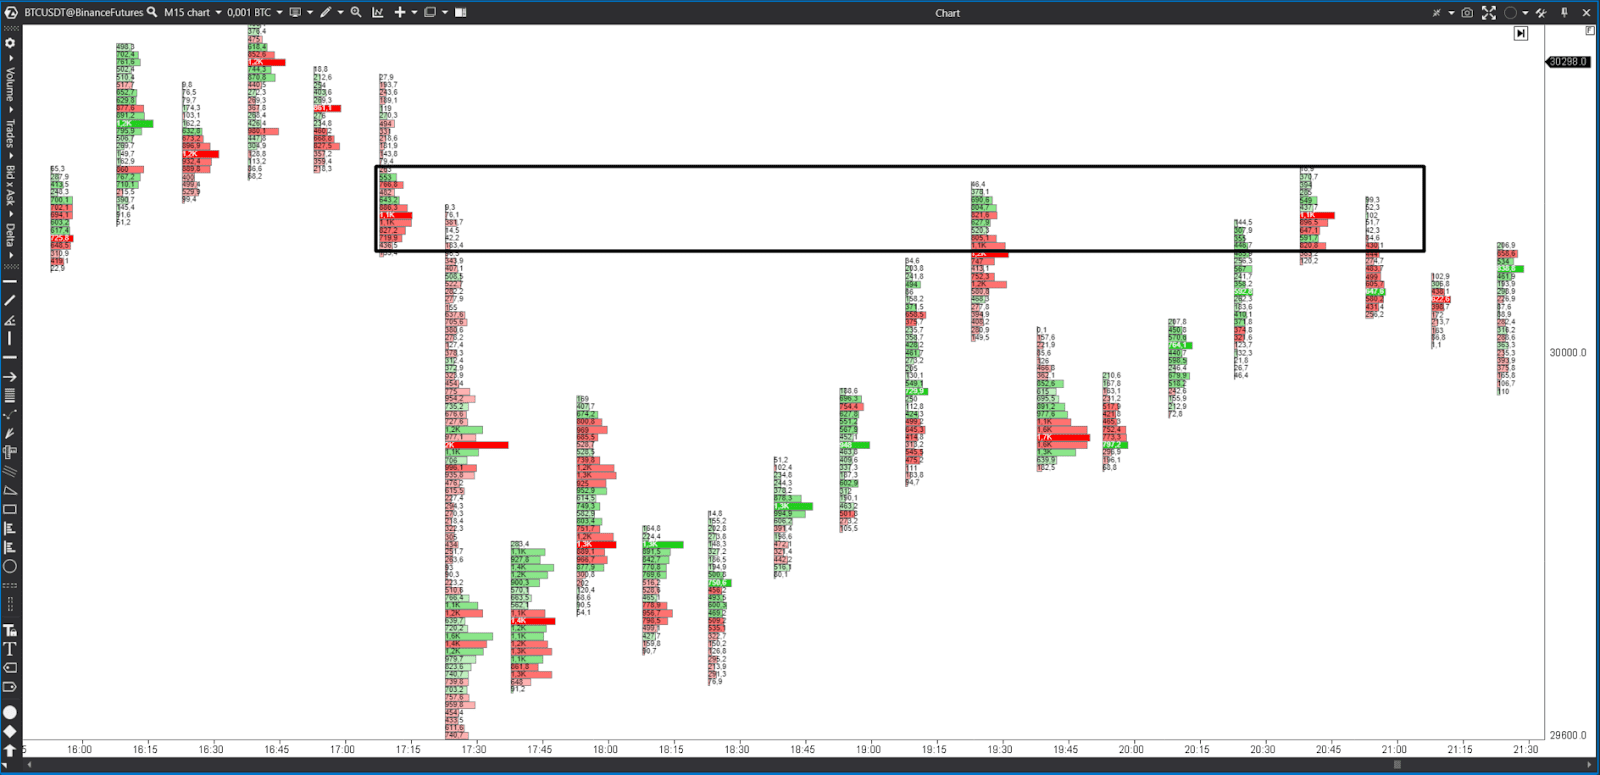
The Volume Profile allows you to identify value zones, which represent price levels at which the most trading activity occurs. These areas can serve as a guide for determining fair value. In this case, you can consider buying near the lower price zone and selling near the upper price zone, anticipating price reactions at these levels.
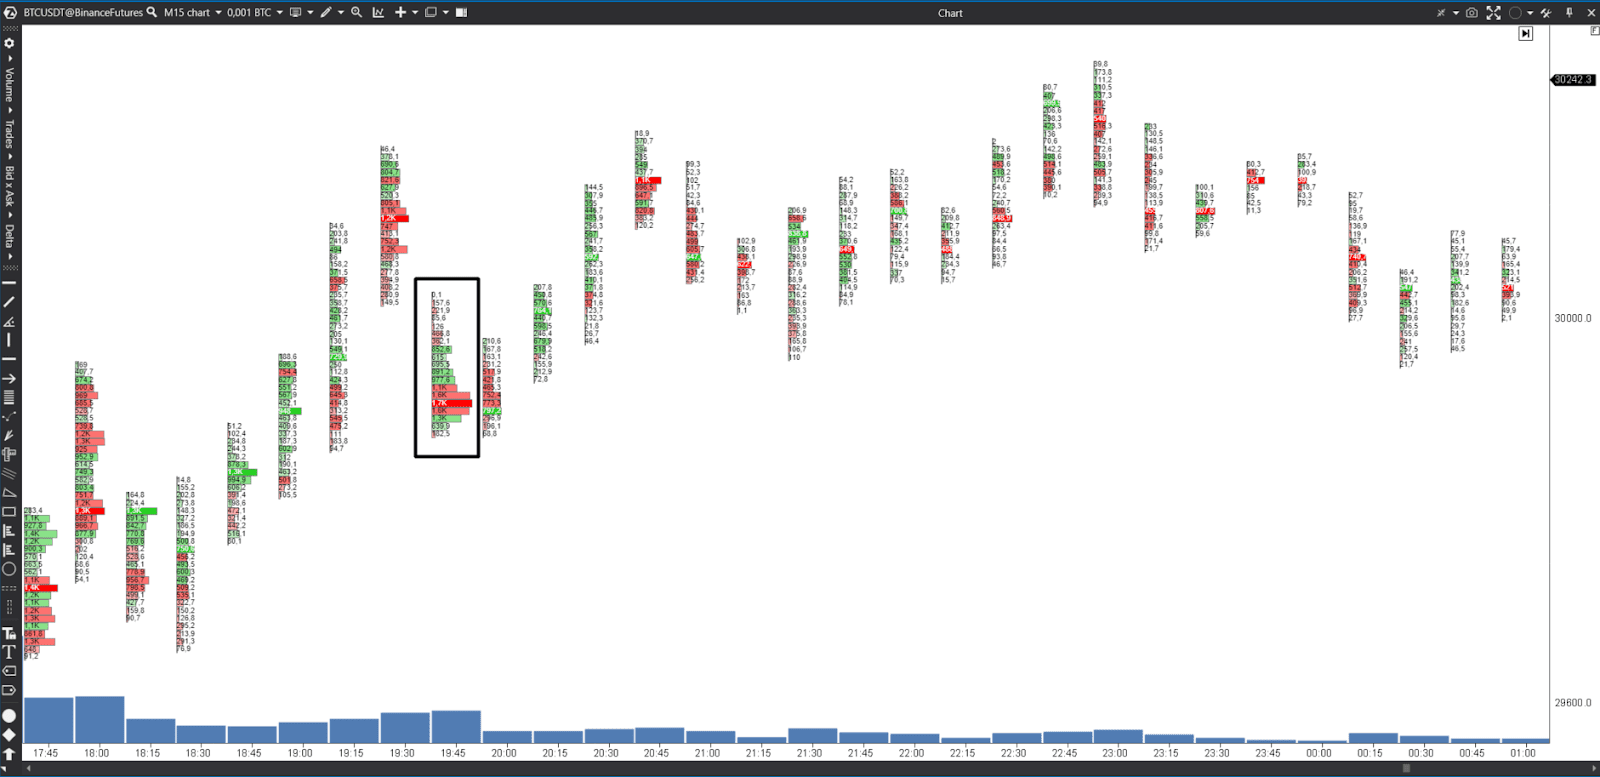
Identify volume clusters, i.e. areas on the chart where a large amount of volume has accumulated. These clusters indicate significant trading interest and can act as price magnets. We look for price reactions, breakouts or rebounds from these volume clusters, using them as potential entry or exit points.
Delta
Delta allows you to see the net difference between the volume initiated by buyers and the volume initiated by sellers. That is, when the delta is greater than zero, the buying volume exceeds the selling volume. How to read Footprint in this case? It helps to determine who is driving the current trend.
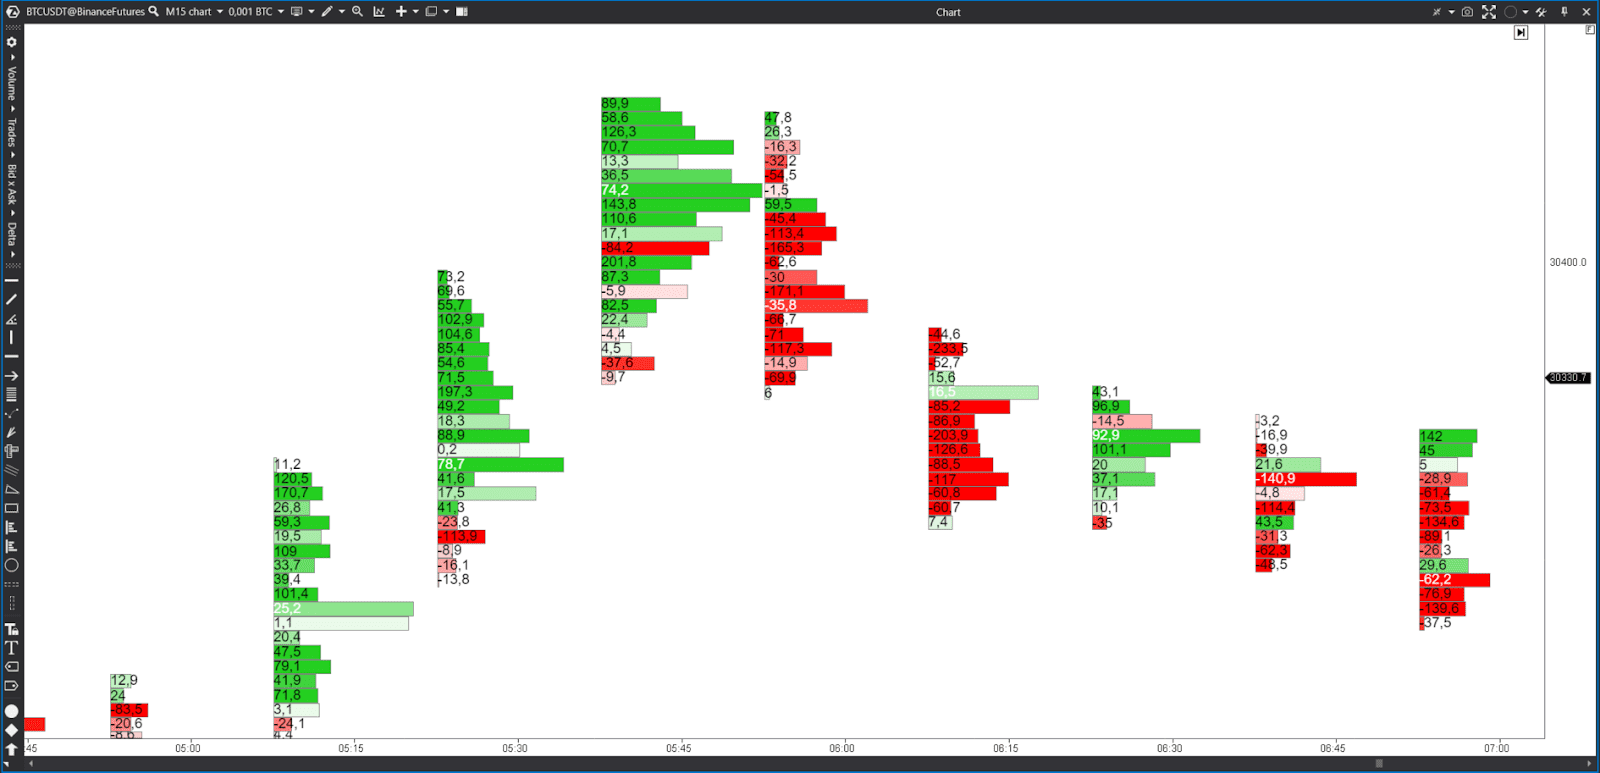
The red color means that there are more sales than purchases. This is accompanied by a negative number in the cell. The green color indicates that there are more purchases than sales, with a positive number in the cell. The darker the shade, the more aggressive the buying/selling.
In a bearish market, you can track negative delta values to identify downward price movements. A larger negative delta indicates a stronger downward momentum, which potentially signals an opportunity to open a short position or sell the cryptocurrency.
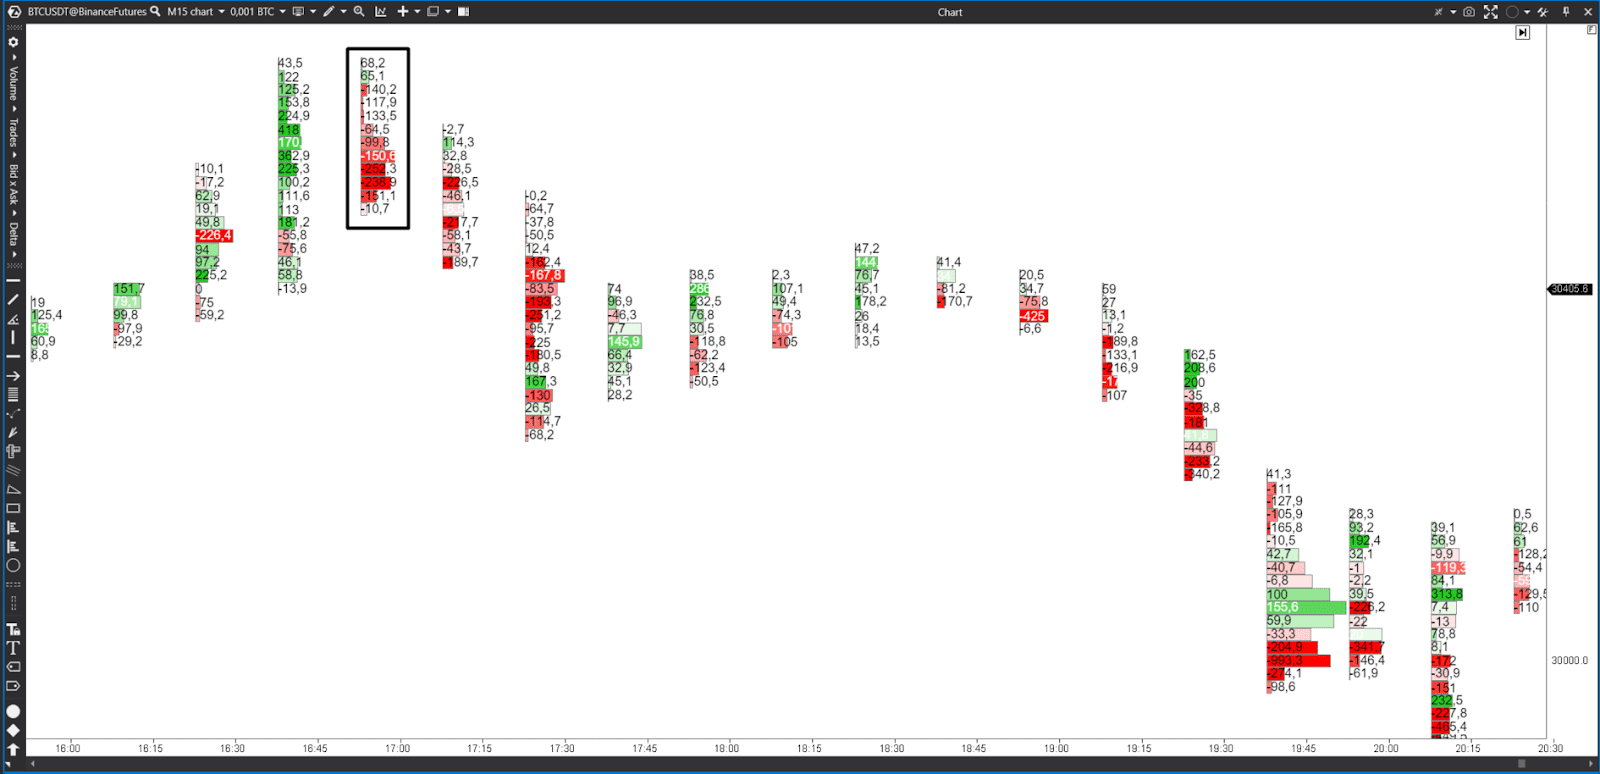
In a bull market, you need to keep an eye out for positive delta values to identify upward price movements. A larger positive delta indicates a stronger upward momentum, which potentially means an opportunity to open a long position or buy a cryptocurrency.
Bid&Ask indicator
This is an indicator that divides the volume into transactions that took place at the Ask price (market purchases) and at the Bid price (market sales). A significant imbalance between supply and demand may indicate a potential change in market direction. For example, if there are more buyers than sellers at a certain price level, this indicates a potential upward movement.
The cell will be colored green if there are more buyers than sellers, and red if there are more sellers. The darker the shade, the more aggressive the behavior of buyers and sellers.
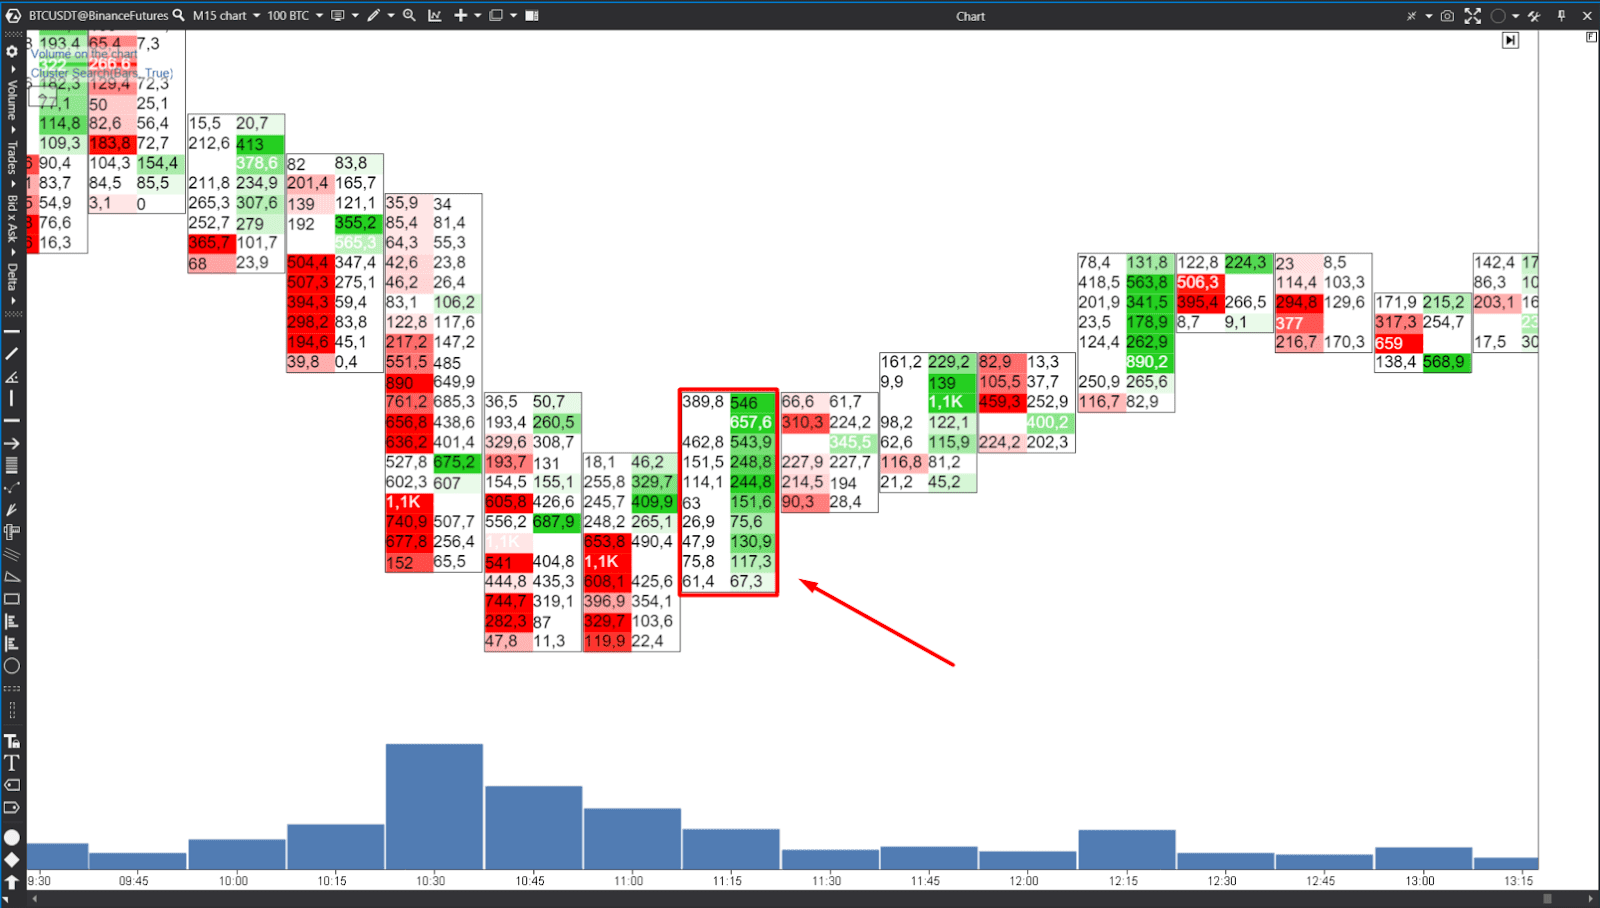
This indicator allows you to assess the strength of buying and selling pressure at different price levels.
How to understand where the market is going and what to do next?
Analyzing the Footprint chart, you can determine the current market direction. If the buying volume (number of contracts) exceeds the selling volume (number of contracts) at different price levels, this indicates bullish sentiment, which points to a potential upward movement in the market. Conversely, if the volume of sales (number of contracts) is higher, it means bearish sentiment and the possibility of a downward trend in the market.
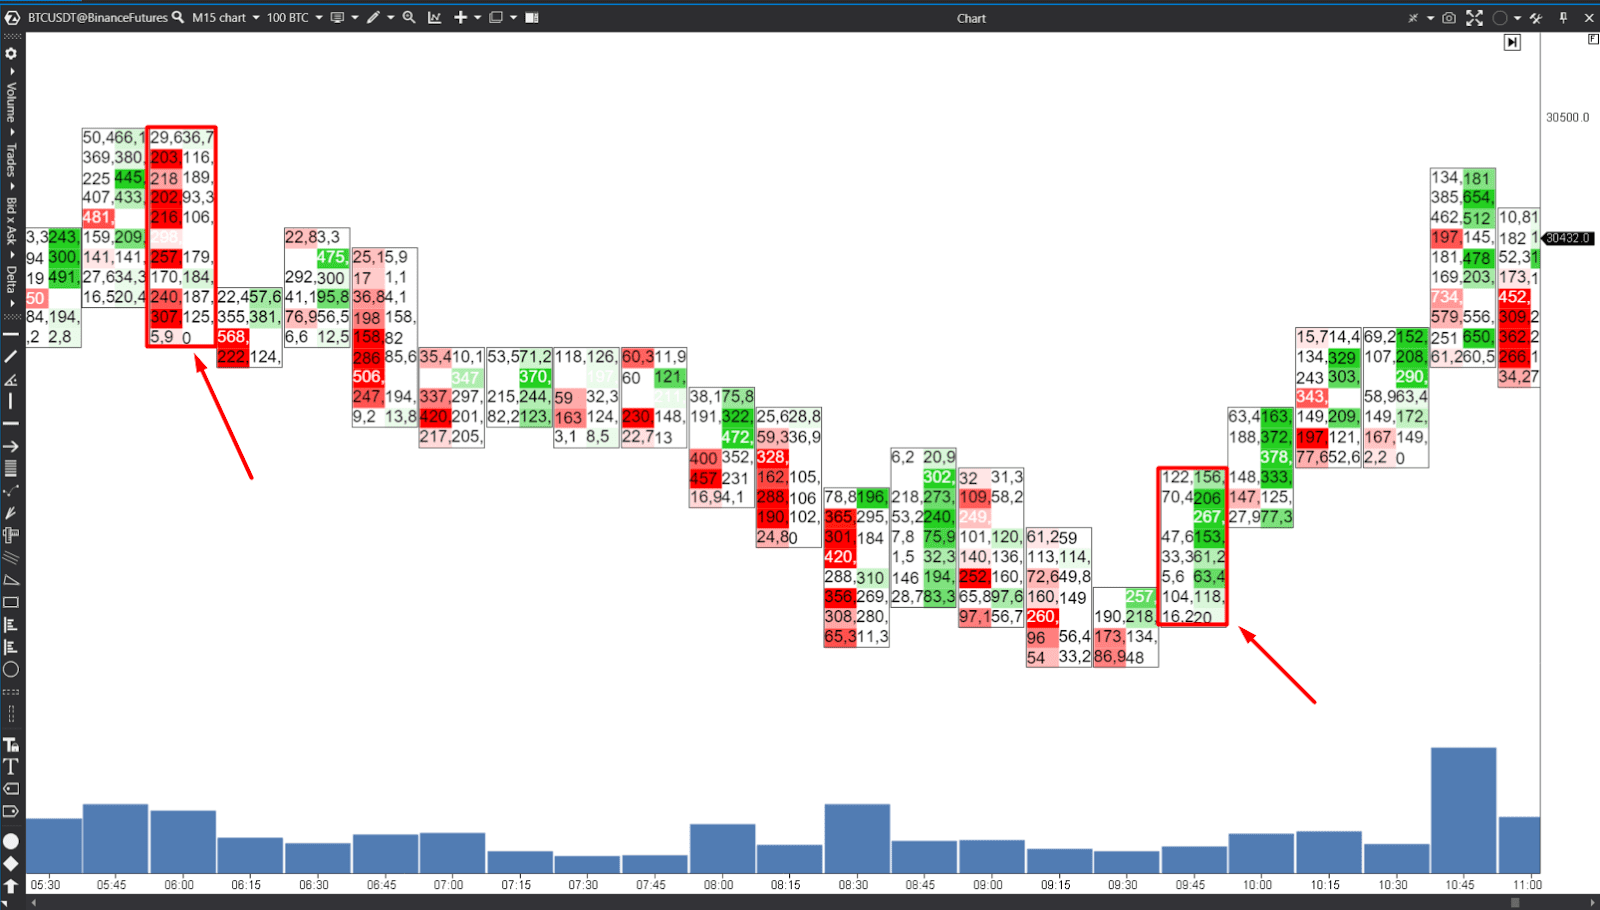
Given the bullish market direction indicated by Footprint analysis, you can take a long position or consider buying. This means that you expect upward price movement based on prevailing buying pressure.
How else can Footprint be analyzed?
Footprint analysis involves studying supply and demand at different price levels to get an idea of the market direction and potential trading opportunities. Here are some other approaches that are also worth using:
Searching for trading patterns. Traders often look for certain patterns on Footprint charts, such as icebergs (hidden large orders), traps (when the price level changes rapidly, taking traders on the wrong side), and exhaustion patterns (indicating a potential trend reversal).
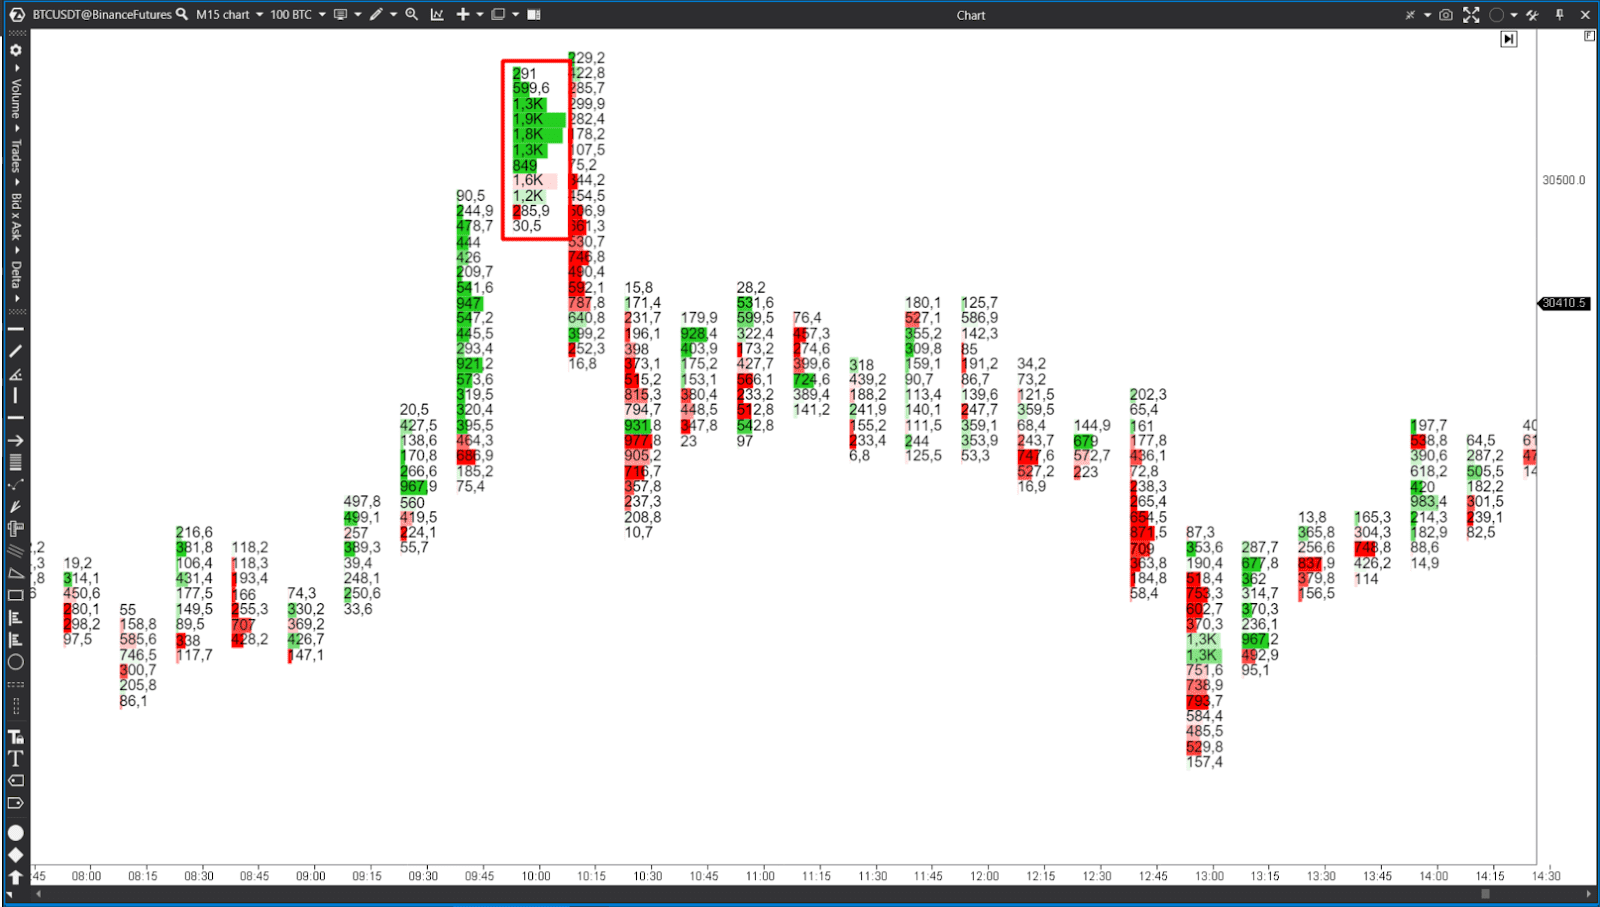
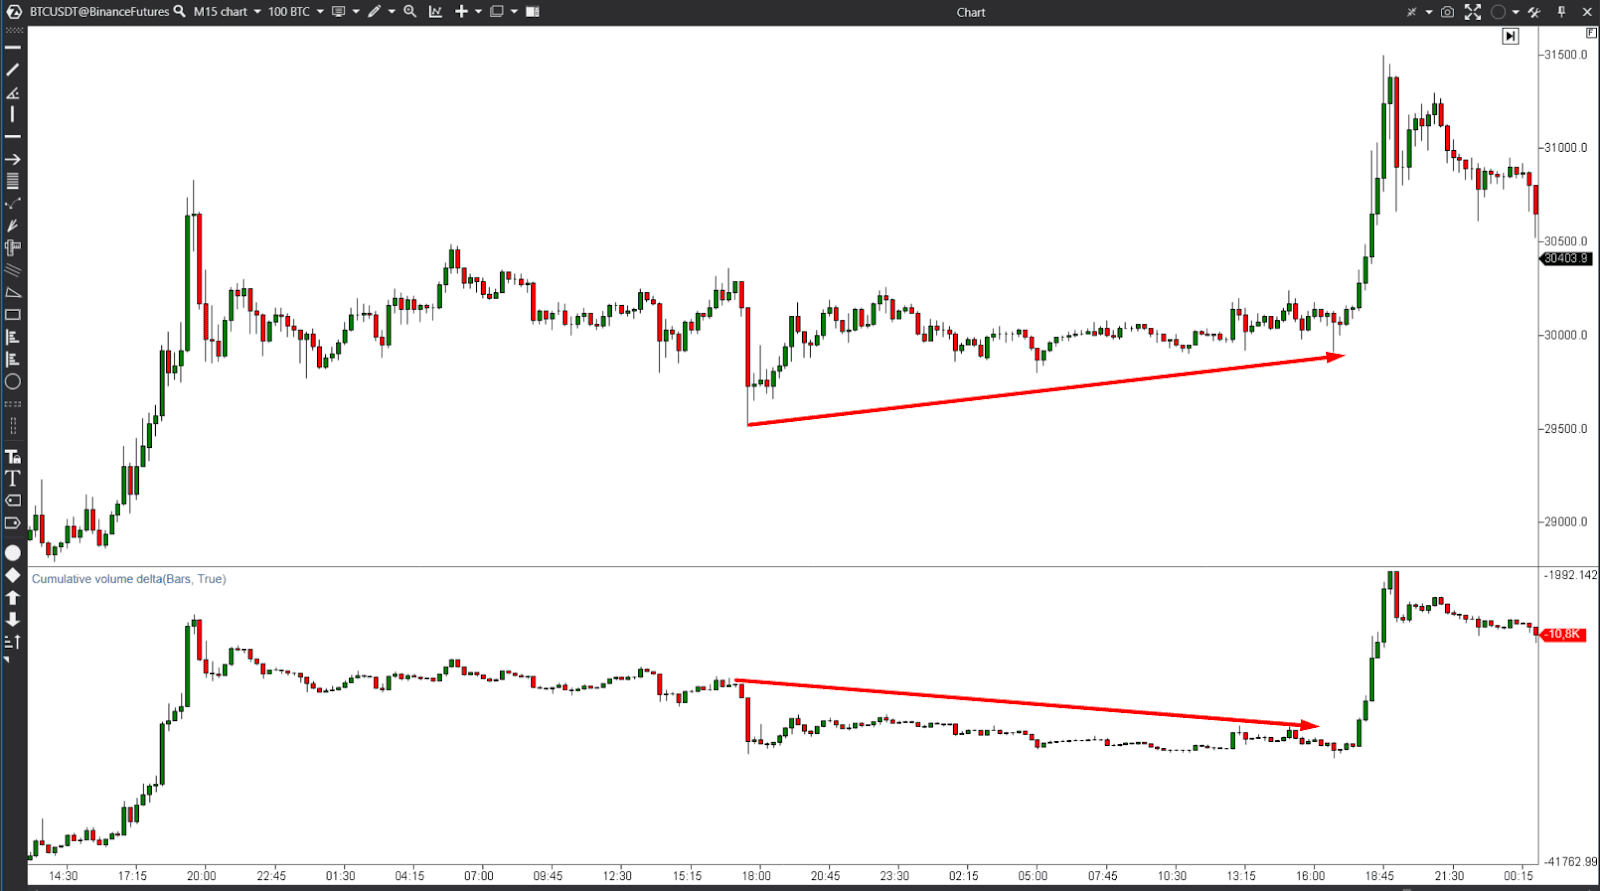
Cumulative Delta. This is a method that summarizes deltas at several price levels to get a broader picture of market sentiment. It helps to identify discrepancies between the price and the Cumulative Delta, indicating a potential trend reversal or continuation. Read more about Cumulative Delta in this article.
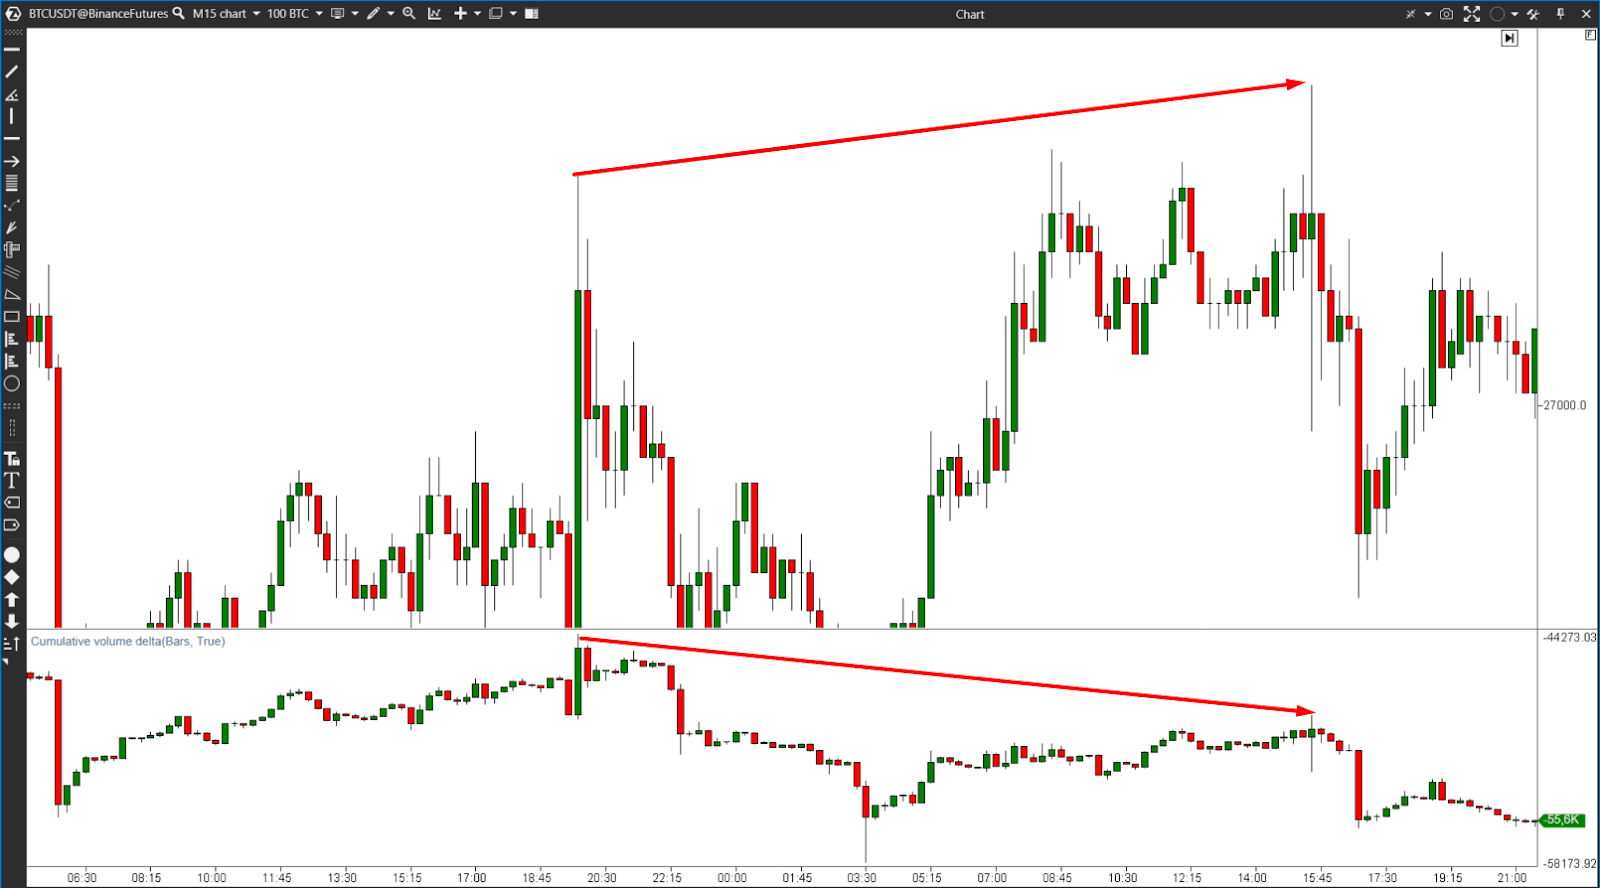
Absorption analysis. It occurs when a large number of sell orders are absorbed by an equally large number of buy orders. This means that sellers are unable to reduce prices, which indicates potential support and a possible trend reversal. Conversely, if large buy orders are absorbed by sell orders, it may indicate potential resistance and a bearish trend.
Conclusion
Footprint analysis is a powerful trading tool and should be used in combination with other technical indicators, risk management strategies, and market analysis. Analysis of the Volume Profile helps to identify significant price levels where trading activity is concentrated. Identifying order imbalances can help traders anticipate potential price movements or reversals, as excessive buying or selling pressure can indicate a change in market direction.

