How to use indicators to predict the movement of crypto?
By Yaroslav Krasko Updated November 11, 2022
BikoTrading Academy
Technical analysis indicators are mathematical algorithms that analyze price parameters according to the developer's specified formula. Technical analysis includes 5 types of data: volume, highs, lows, opening and closing prices. These indicators are the basis of all technical indicators. The main task of the indicators is to identify the market trend and its reversal points.
Top 7 main crypto indicators
In this article, we will show you 7 main indicators and tell you how to predict the movement of cryptocurrency with the help of these indicators.
Vertical volume
It is known that the price moves from liquidity to liquidity. That is, from volume to volume. In our opinion, volume is one of the first and main indicators that every trader should have. Despite the simplicity of this indicator, it is quite difficult to overestimate its value. Volume shows the number of coins that have been traded in a certain period of time (hour, day, week, etc.).
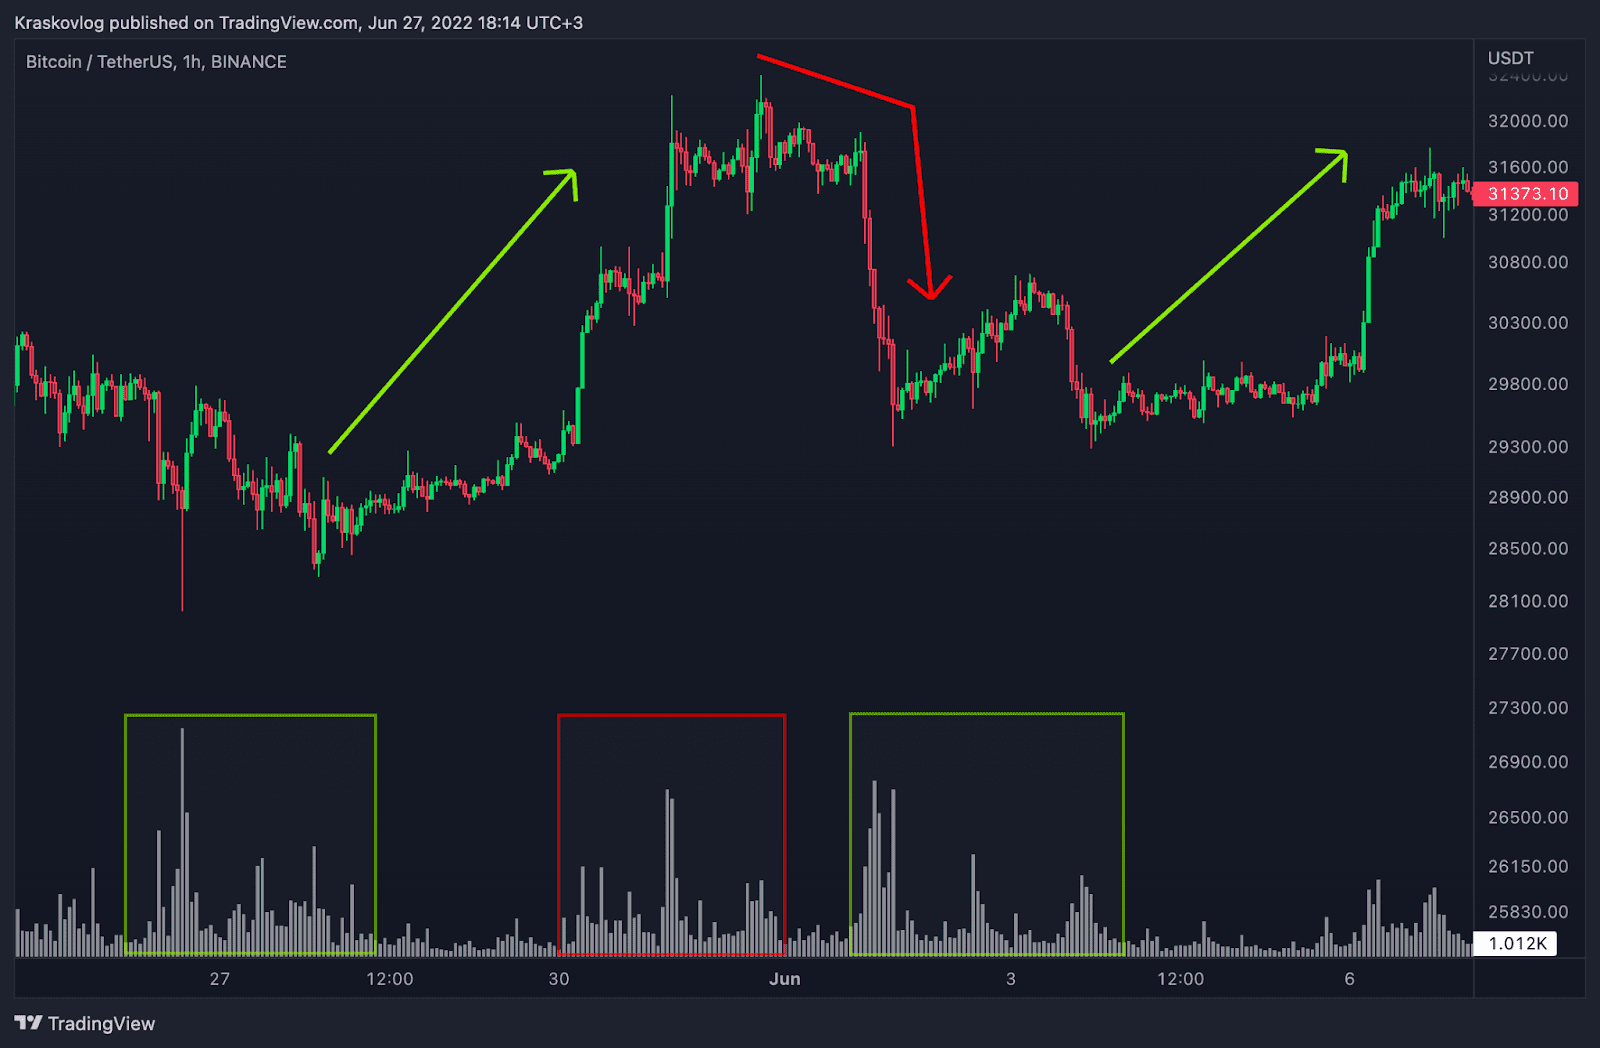
In the chart above, we have marked exactly how the price moves from volume to volume. The appearance of large volume during the fall indicates that buyers have received enough liquidity and after that the price will soon reverse and go up and vice versa, the appearance of volume at the top during the rise in price indicates a possible reversal and fall in price.
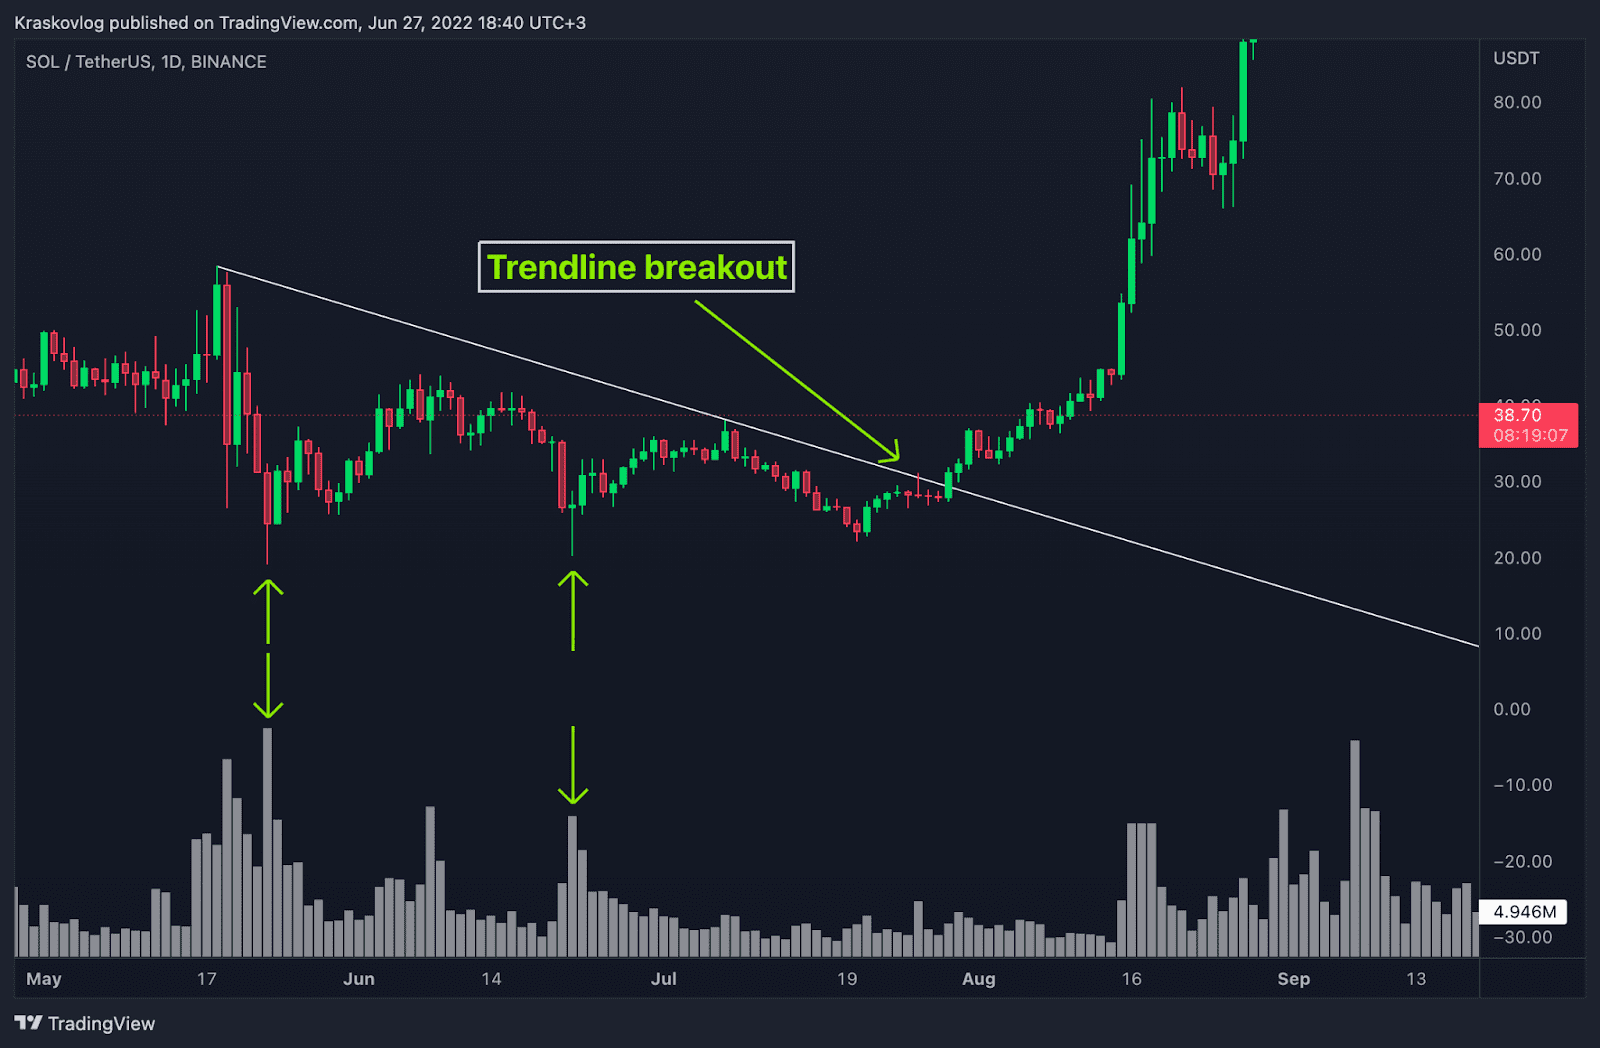
Our main strategies: breakout and false breakout. Above there is an example of how great these strategies work when combined with volume. During the price fall, a large volume appeared at the bottom, followed by the formation of a trend line, a breakout of the trend line and a rapid rise in price.
Horizontal volume
Horizontal volume, as opposed to vertical, shows us how much volume has been traded at selected price points. Below there is the trading history for the last month, using the horizontal volume we can see that the price range of $20 - $21.5 thousand has been traded more than the total volume.
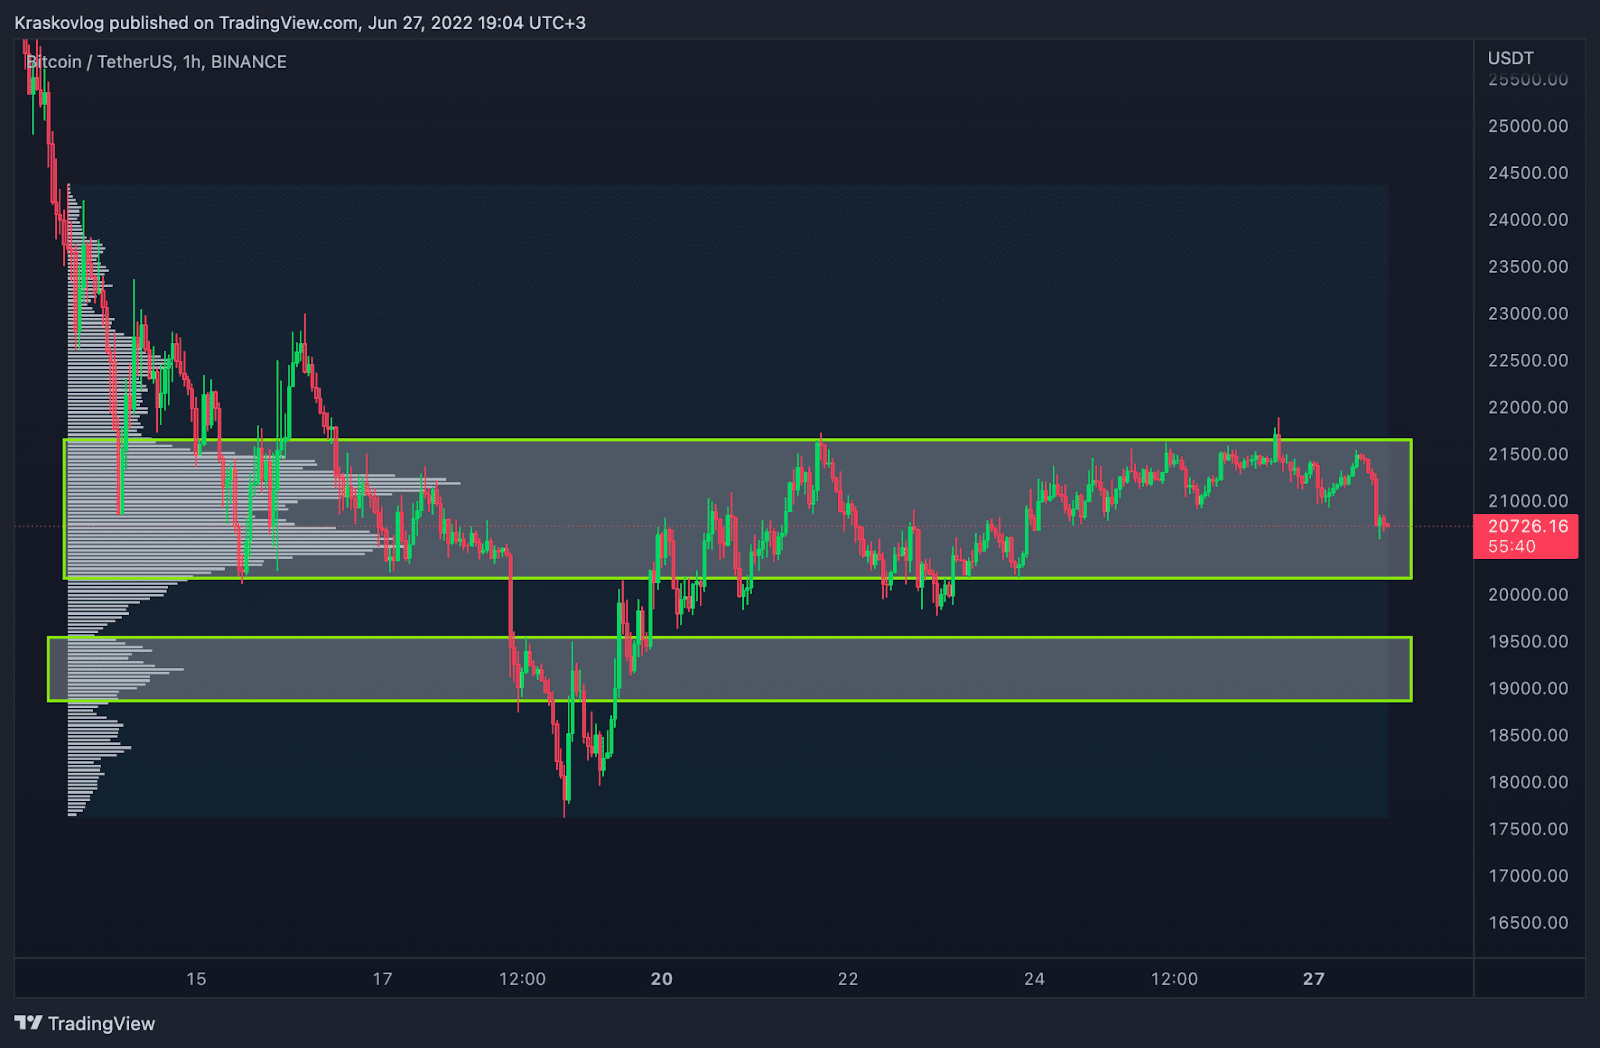
Well, we have found out where most of the volume was traded, what does that give us?
Firstly, we understand where most of the liquidity is located, and as we already know, the price moves from liquidity to liquidity.
Secondly, we can highlight liquidity gaps. The price cannot stay without liquidity for a long period of time and, as a rule, immediately reacts to the lack of liquidity.
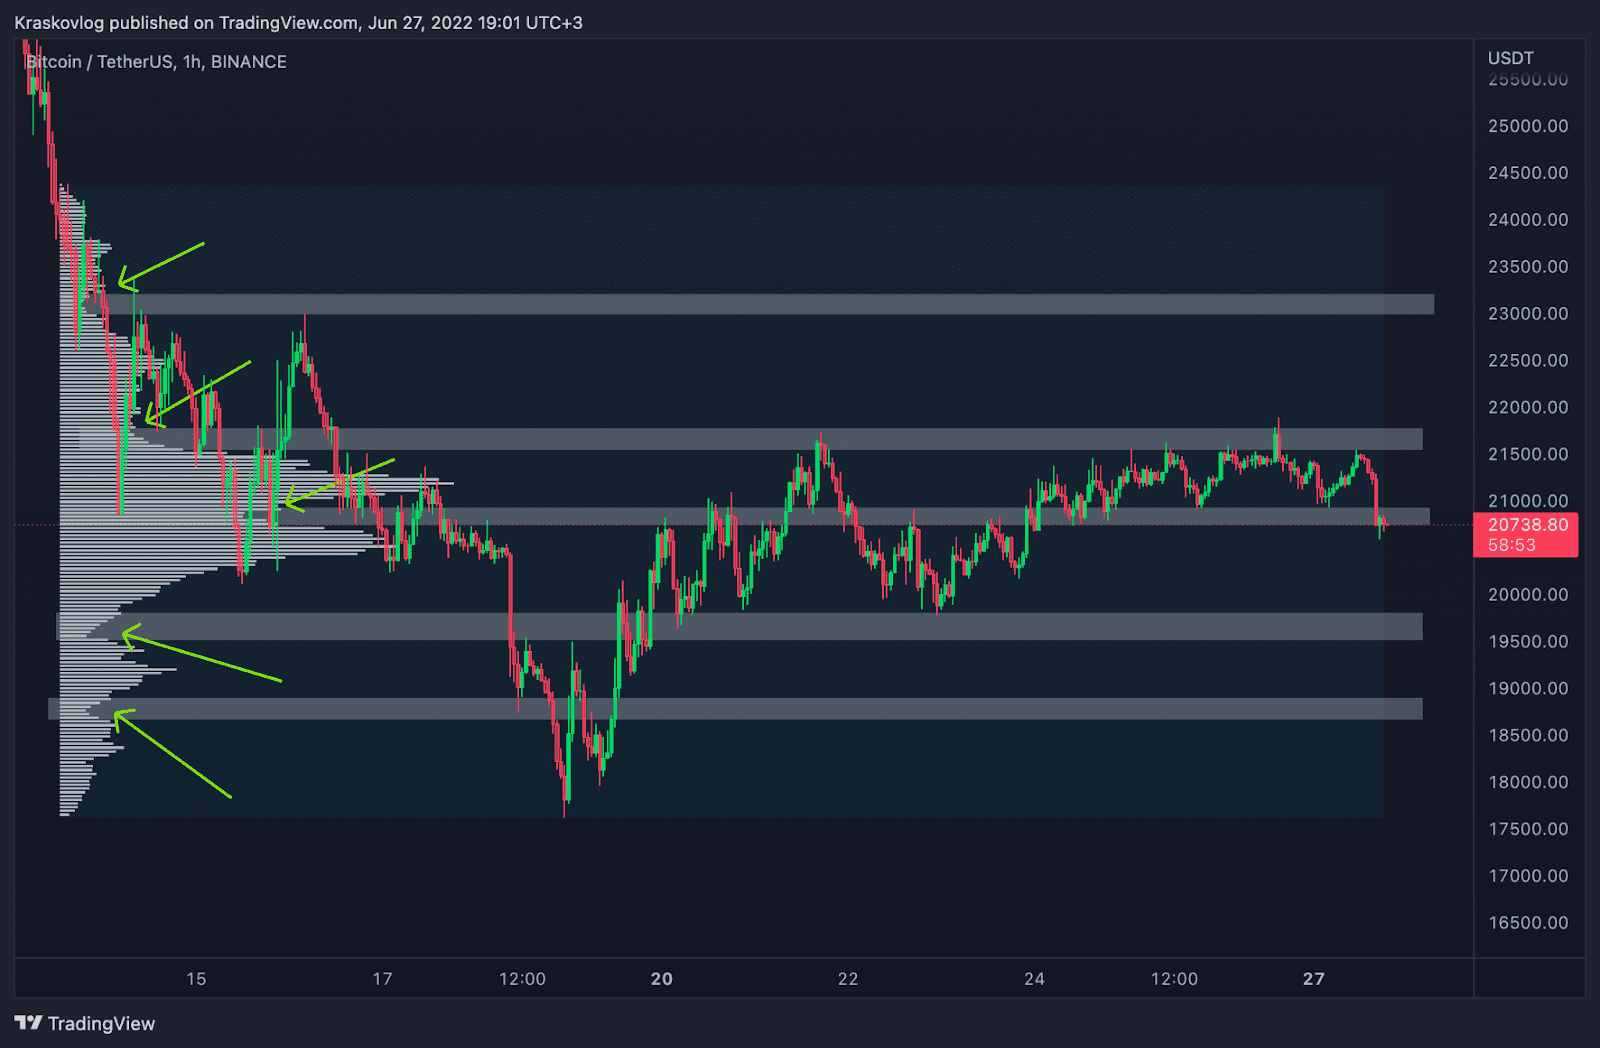
In our case, we can highlight these areas, which in time will act as strong support and resistance zones. The screenshot above clearly shows how the price reacts to them.
Moving average
It has long been proven that the price always reverts to its average values. Price averages constantly act as support and resistance, or can help identify a market trend and its change. This is where the moving average indicator can help us.
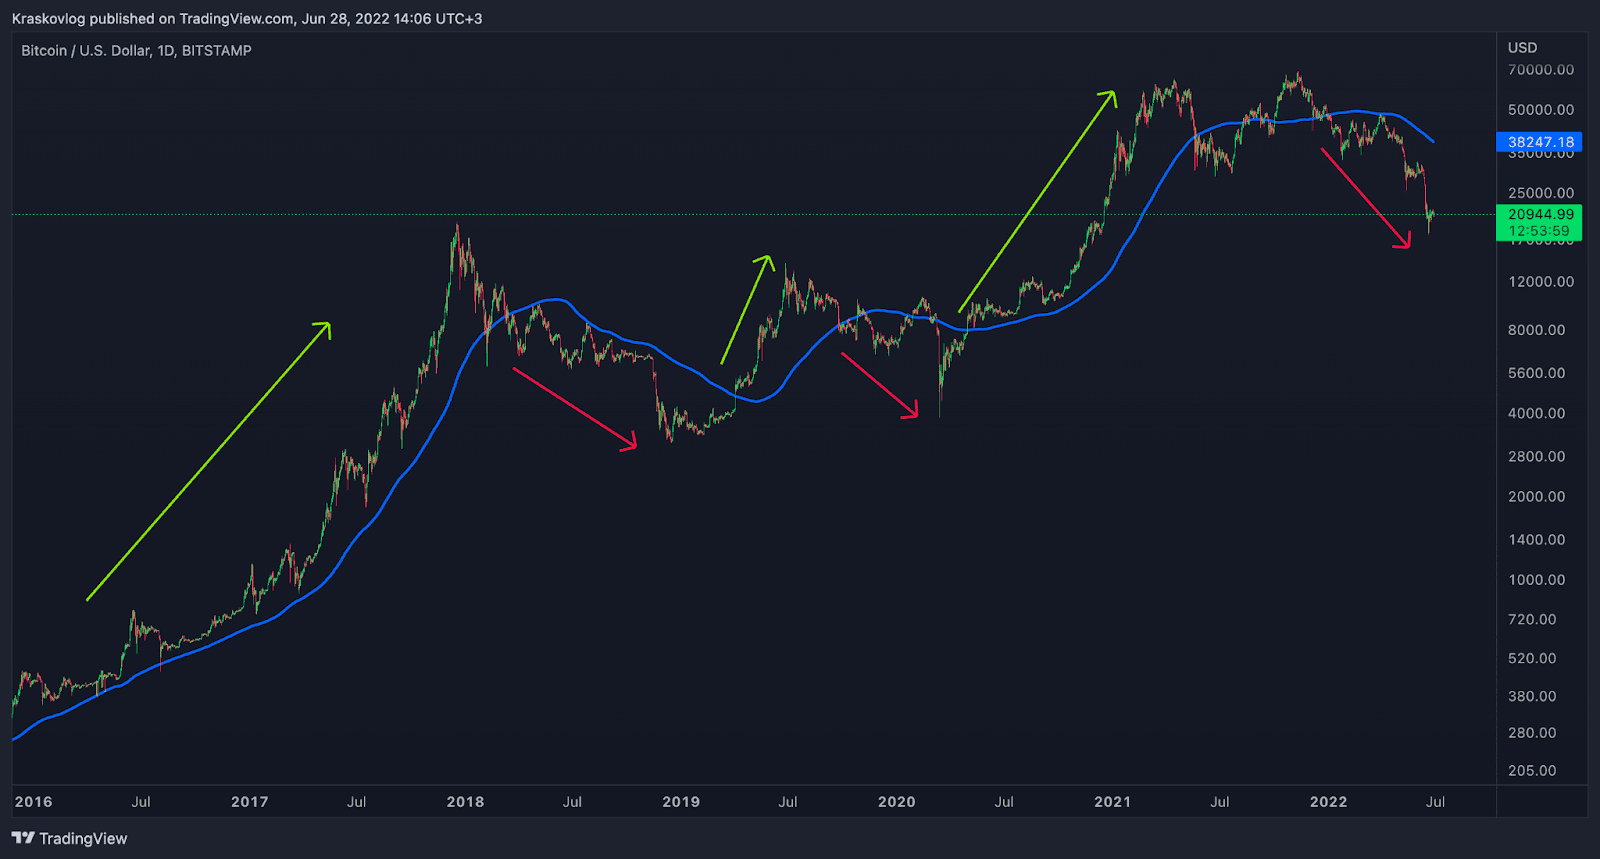
A moving average is a common indicator that shows average price values over a set period. The chart below shows an hourly chart (i.e. 1 candle = 1 hour) and a moving average with a period of 50. In this case, the price shows the average price values for the last 50 hours.
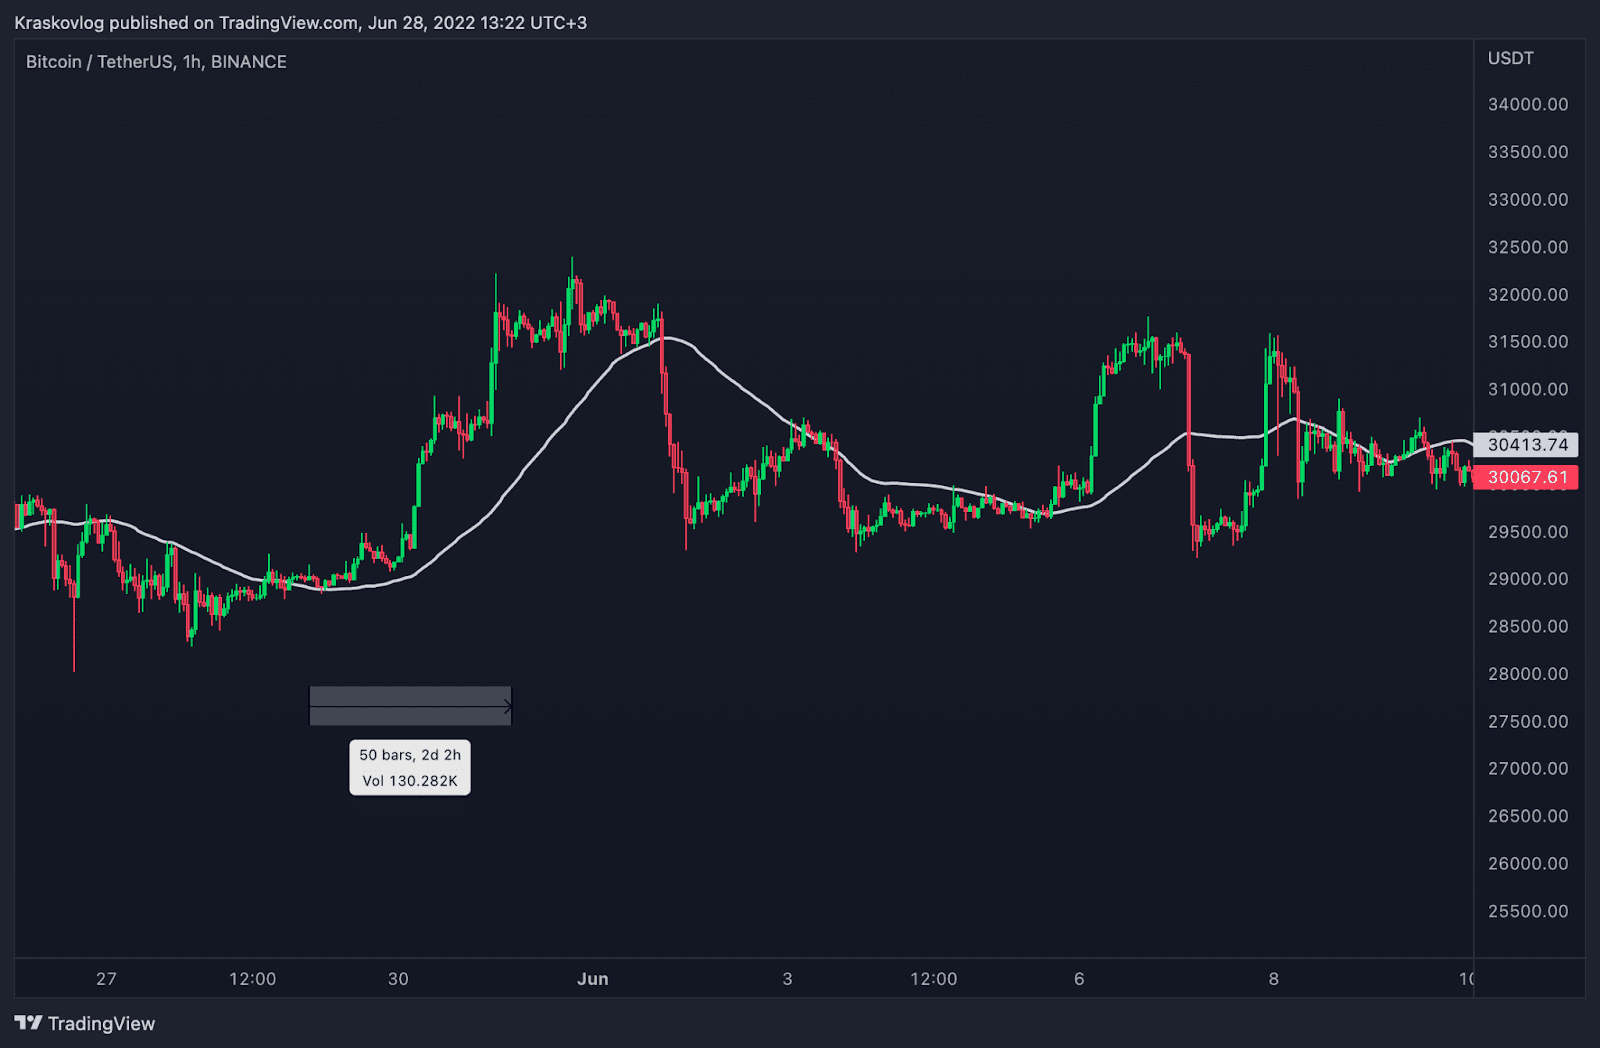
Most often, traders use moving averages with a period of 50, 100, 200. Using a 200-day moving average, you can clearly identify the upward and downward trend of the entire cryptocurrency market.
VWAP
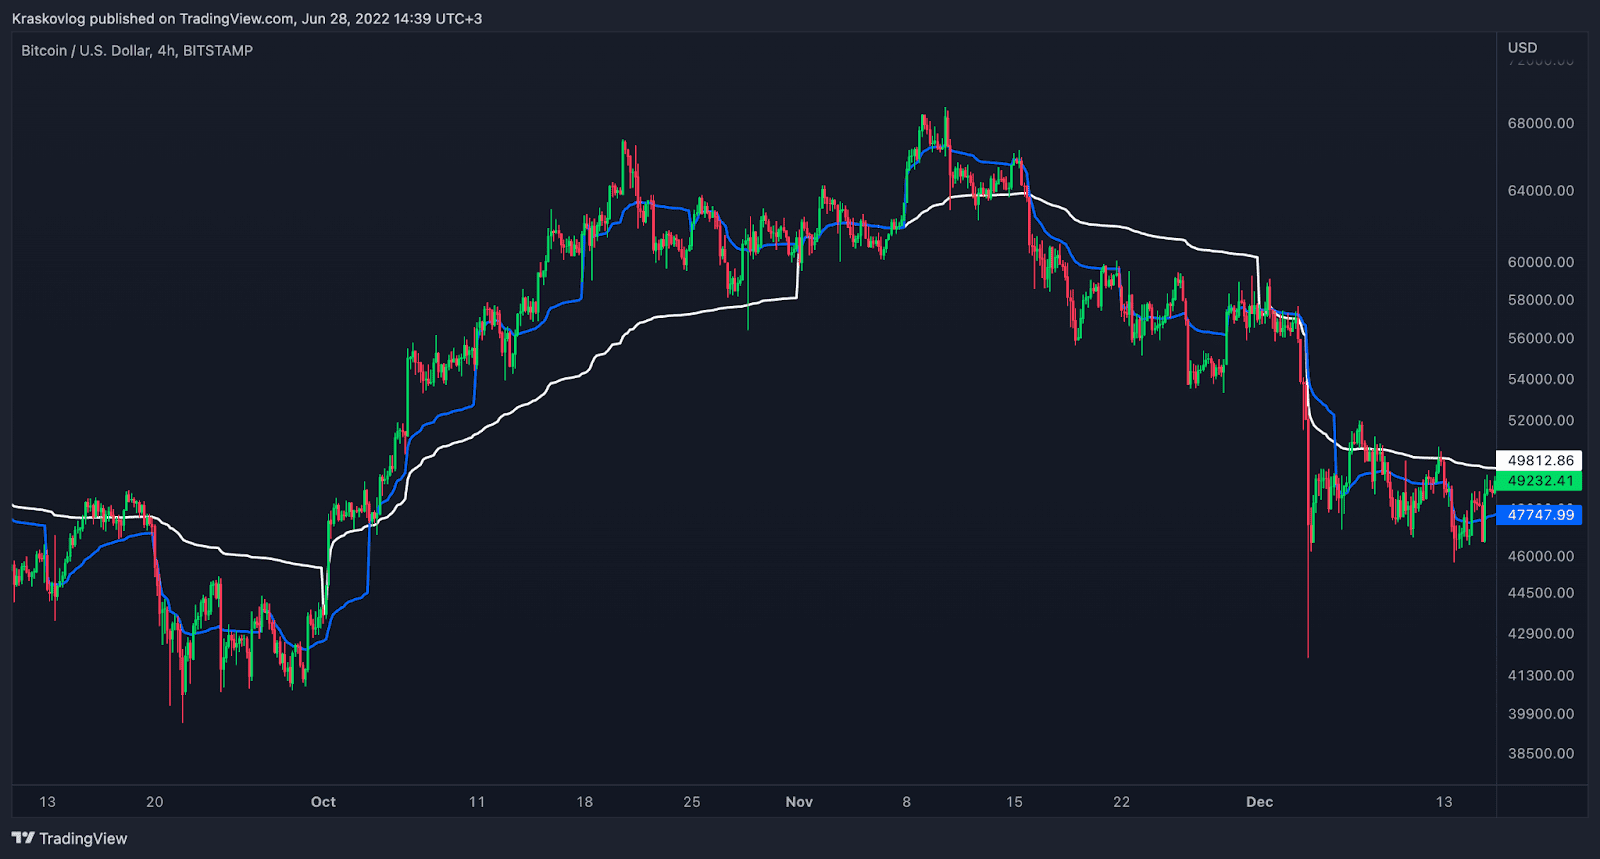
Another very useful tool that we personally use in our own trading is the VWAP, this indicator shows the direction of the trend quite accurately, especially when using the weekly and monthly VWAP together. You can read more about this system in this article.
RSI
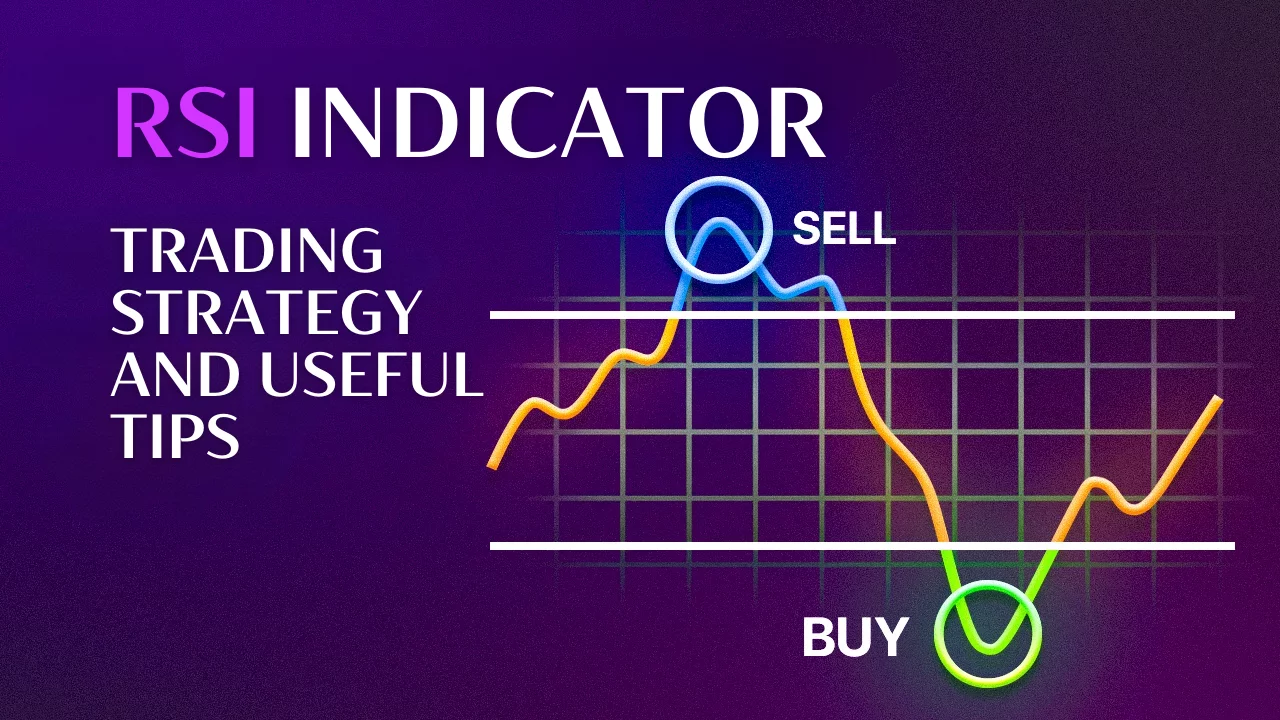
The relative strength index (RSI) is a technical analysis indicator that reveals the strength of the trend and the probability of its change.
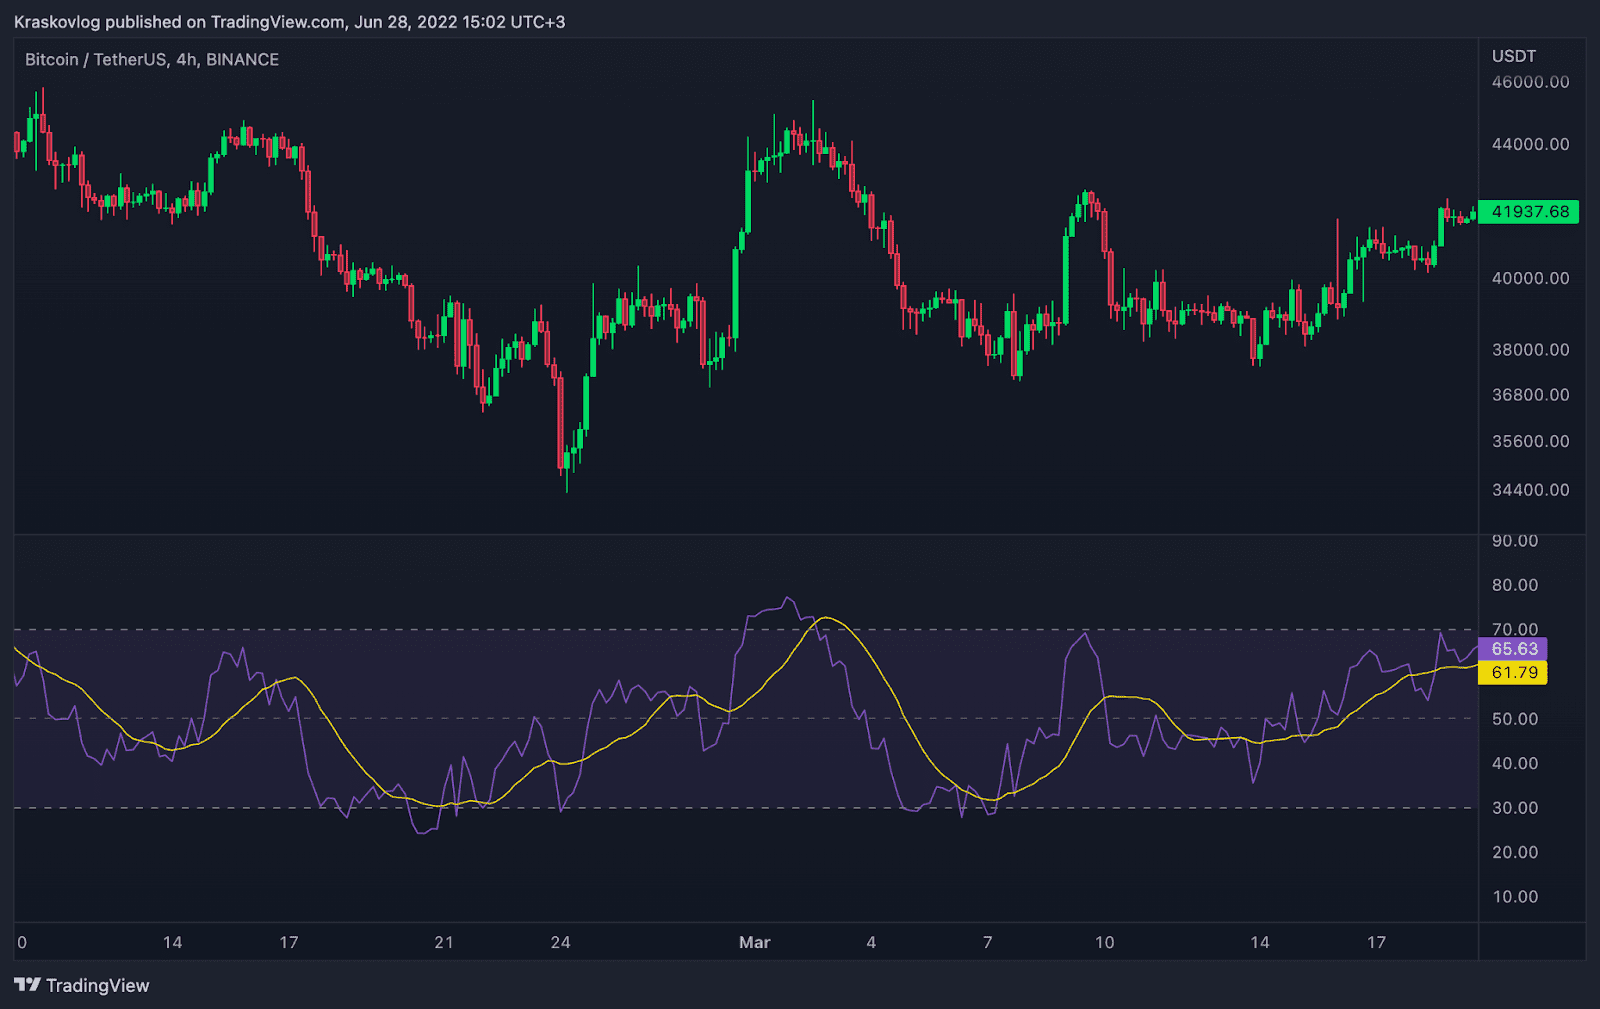
If the index line is above the 50 level, it indicates the strength of the trend and the preference of buyers and vice versa. The 70 and 30 levels, which show the overbought and oversold market, are considered very important levels of the index.
A large number of market participants do not always interpret the relative strength index correctly. Some open trades immediately after the index breaks above the 70 level or below the 30 level in anticipation of a reversal. But this is not entirely correct, since the output of the index beyond these levels only indicates the maximum level of strength on the part of buyers and sellers. At this time, the price moment is only accelerating. And the return of the index below 70 or above 30 indicates the loss of the initiative of sellers or buyers and the future reversal of the price.
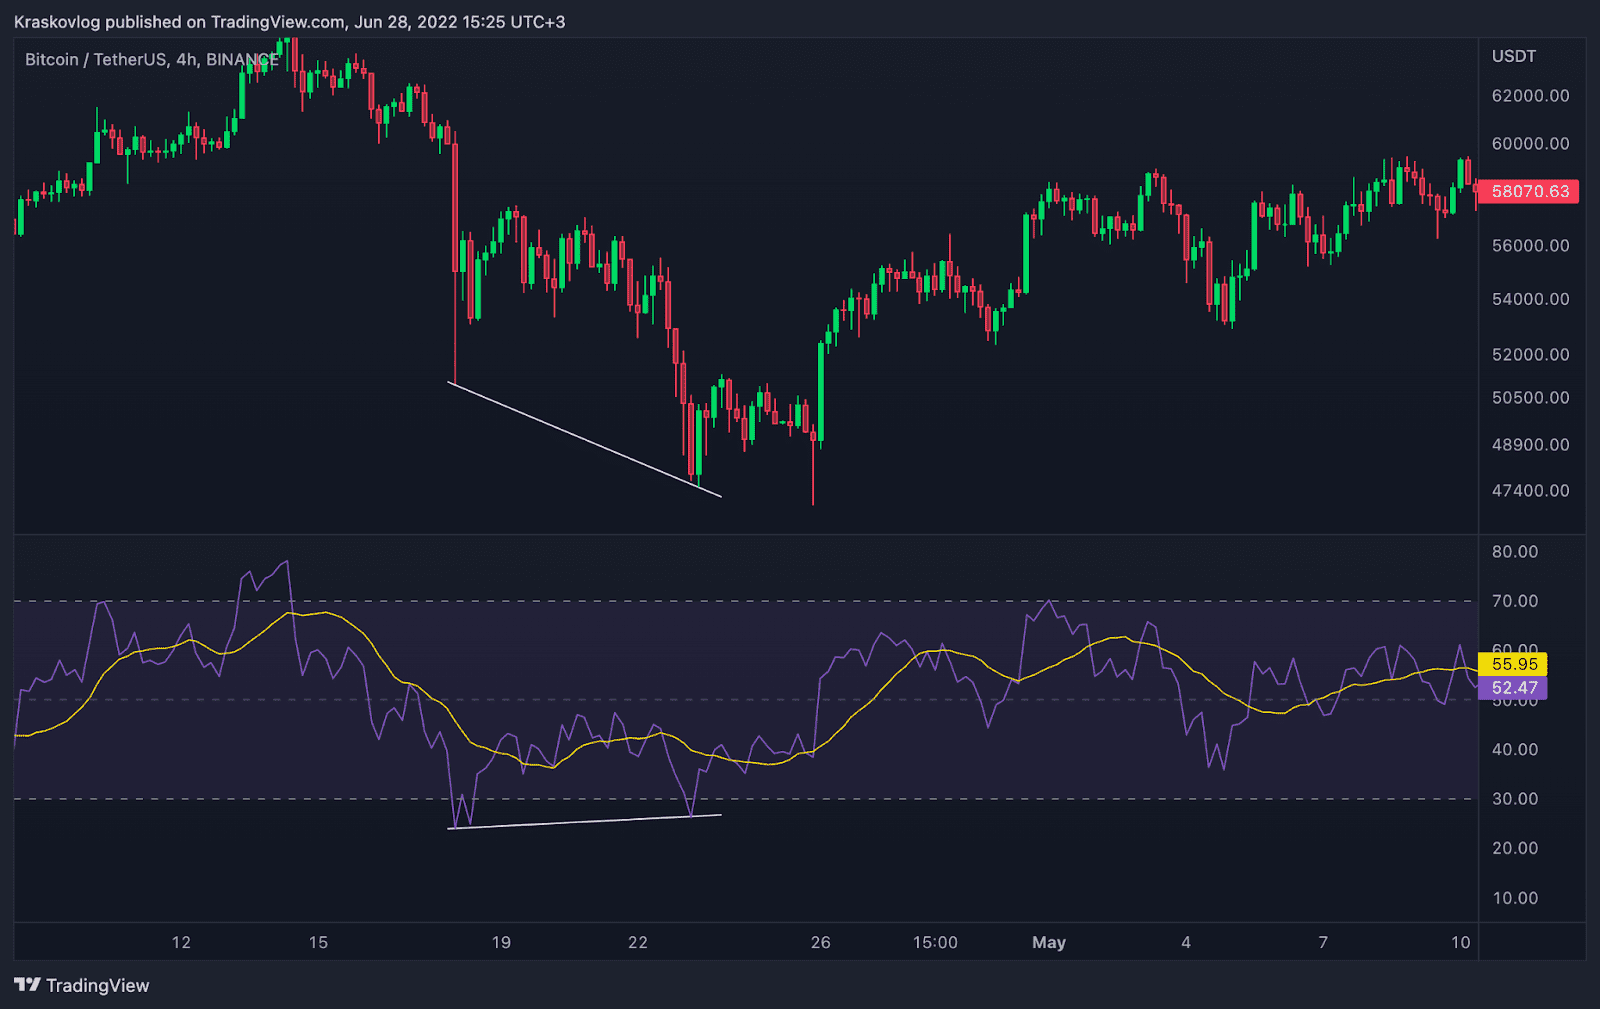
Another example of exactly how the relative strength index can be used is to identify divergences (differences) between the price and the index. The chart above shows a good example. The price has renewed its previous minimum values, but the index on the contrary says that the price moment is stronger and has not been able to renew its previous values. This is the divergence, as a result the direction of the price turned around and went in an upward trend.
MACD
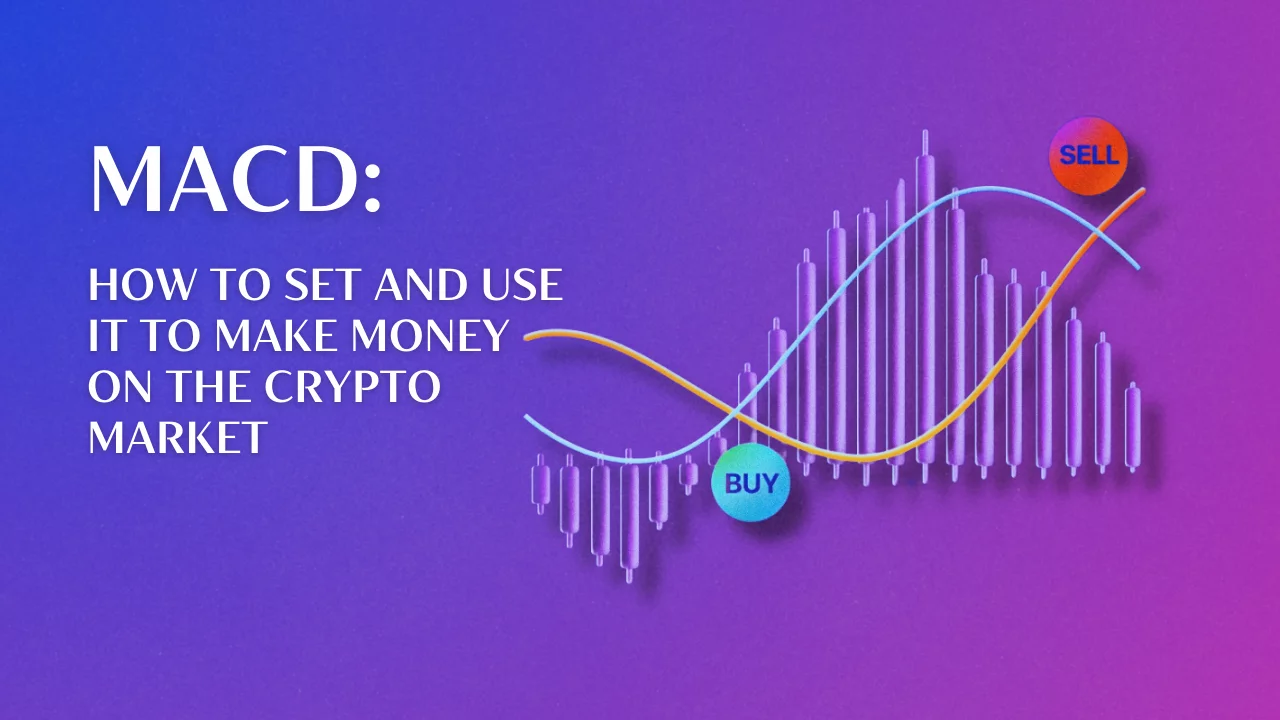
MACD is probably one of the most famous indicators. It consists of moving averages and a histogram. Traders use MACD to determine price strength and trend direction.
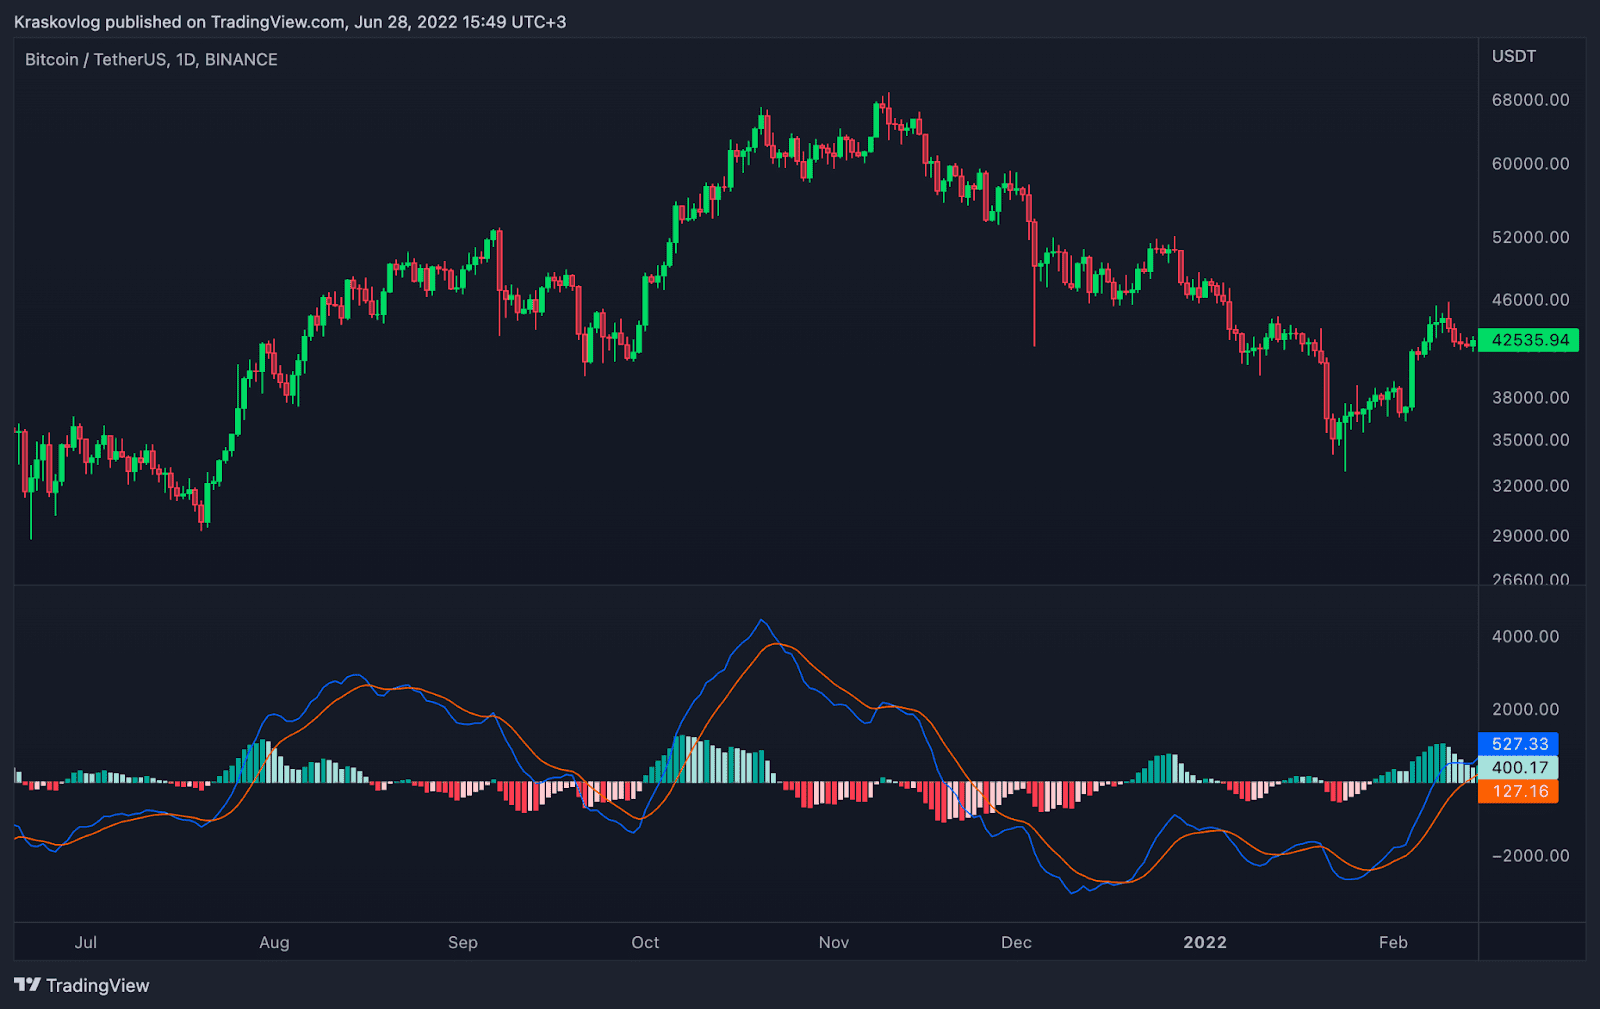
How to use the MACD? The first method is the interpolation of moving averages. If the blue line is above the red, this indicates the strength of buyers and possible price growth, and vice versa. The second method is a histogram. The color of the columns can tell us quite a lot about the intentions of buyers or sellers and warn in advance about a possible price reversal. The third way is to look for divergences (differences between the price and the histogram lines).
Bollinger Bands
And the last indicator in our list is Bollinger Bands. The main task of this indicator is to measure the average volatility (fluctuations) of the price, which as a result makes it possible to determine the support and resistance levels of the price. This type of indicator works quite well during periods of a sideways trend. If we look at the chart below, the price test of the lower limit was a good buying opportunity and vice versa.
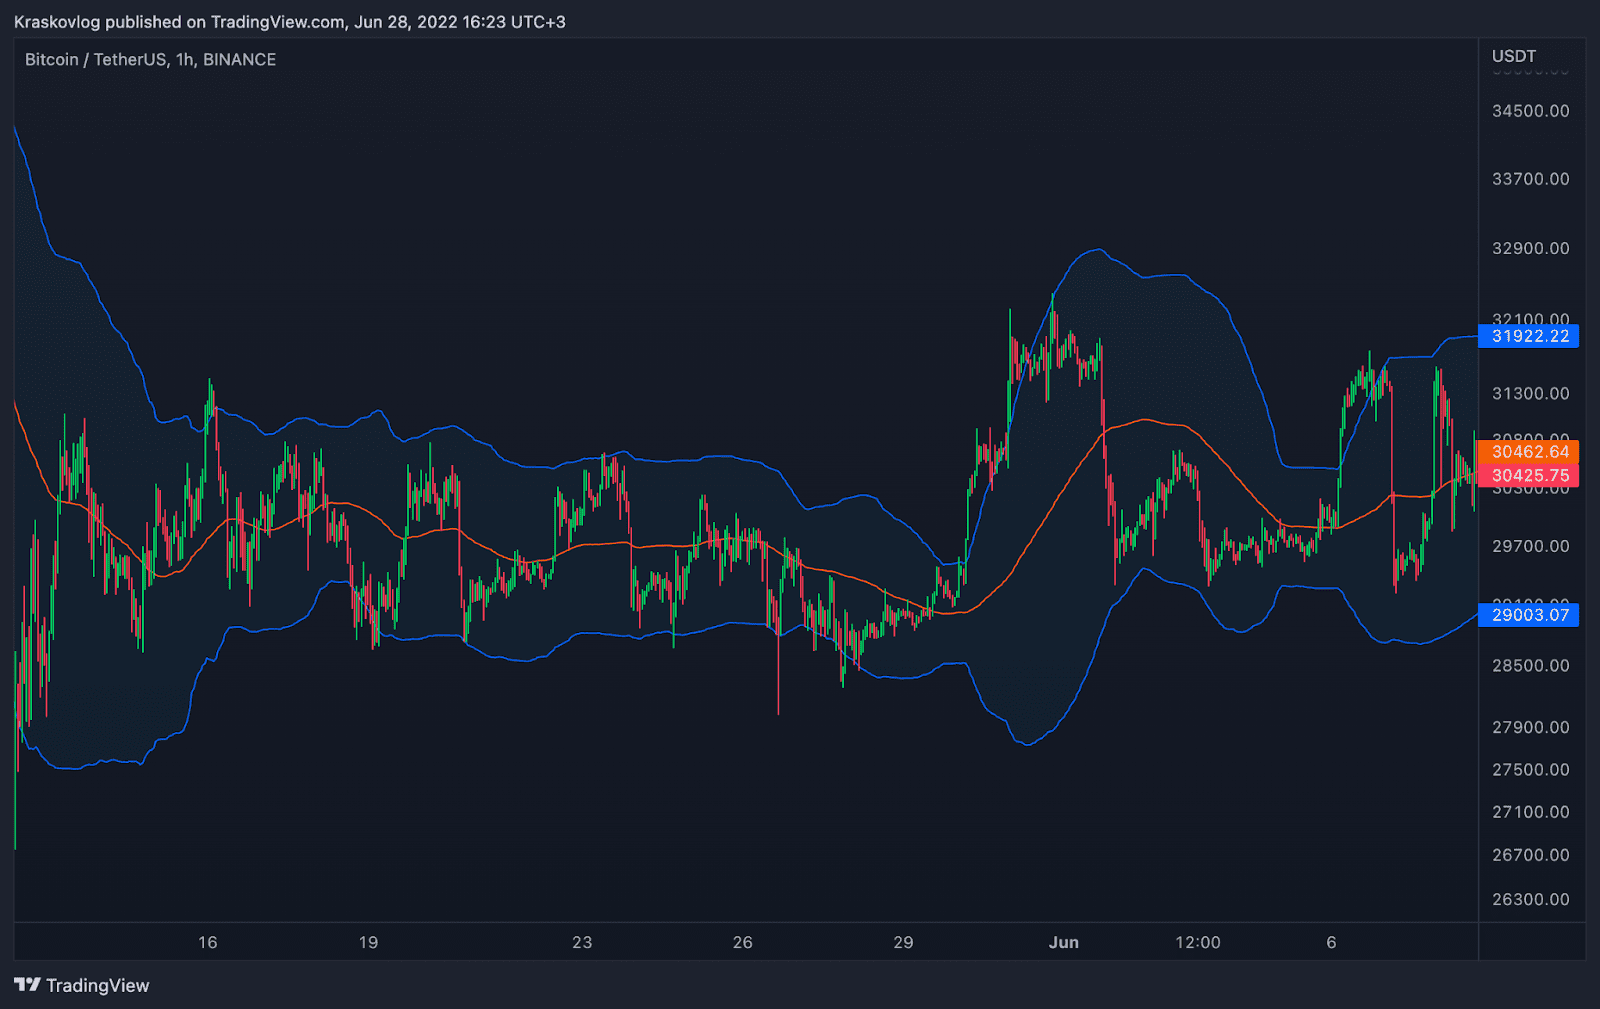
We recommend that you try to change the settings of the indicator to suit yourself. We have noticed that changing the length of the lines to the 80 level provides more accurate points to open positions.


