The best patterns for crypto trading. What to choose?
By Yaroslav Krasko Updated April 19, 2024
BikoTrading Academy
Most newcomers, as soon as they enter the market, the first thing they start to pay attention to are trade patterns. But without understanding this issue, they start making mistakes and losing their money. Jumping into trading solely based on chart patterns, crypto trades can amplify the risks of making costly mistakes and losing investments. But to use them properly and grow the account? Let’s talk about different patterns in the article.
KEY ISSUES:
Quite often from inexperienced traders you can hear that the patterns are drawn by whales (so-called big players). But this is not the case, whales do not meet and do not agree with each other in order to draw this or that pattern.
A pattern is a normal price behavior, a regularity that tends to recur periodically in the market. Traders gave names to the most common models: triangle, head and shoulders, double bottom, double top, etc.
What trading patterns are there?
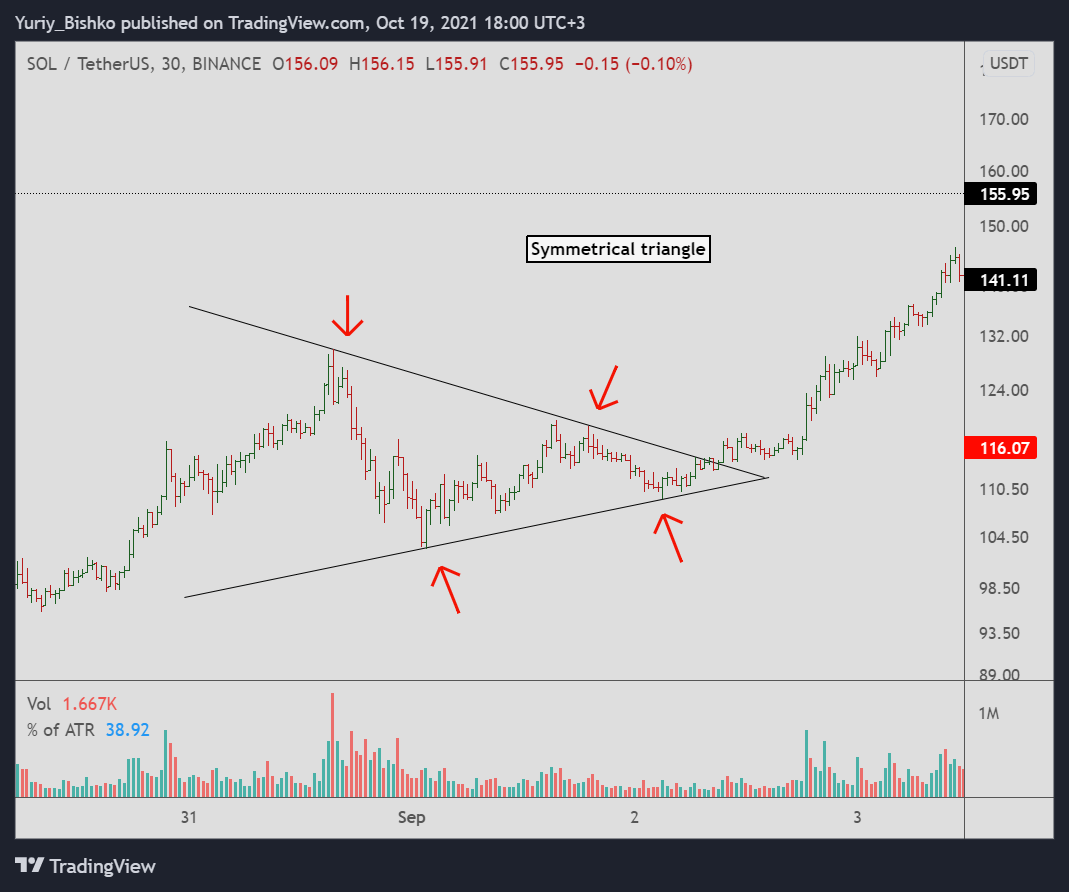
Symmetrical triangle
Symmetrical triangle - one of the most common formations on the chart. During the formation of the figure, the price fluctuates between two narrowing trend lines: up and down. A symmetrical triangle often leads to a continuation of the trend. The pattern can be considered complete after the breakout of any of the levels, the direction of the breakout indicates the direction of further price movements.
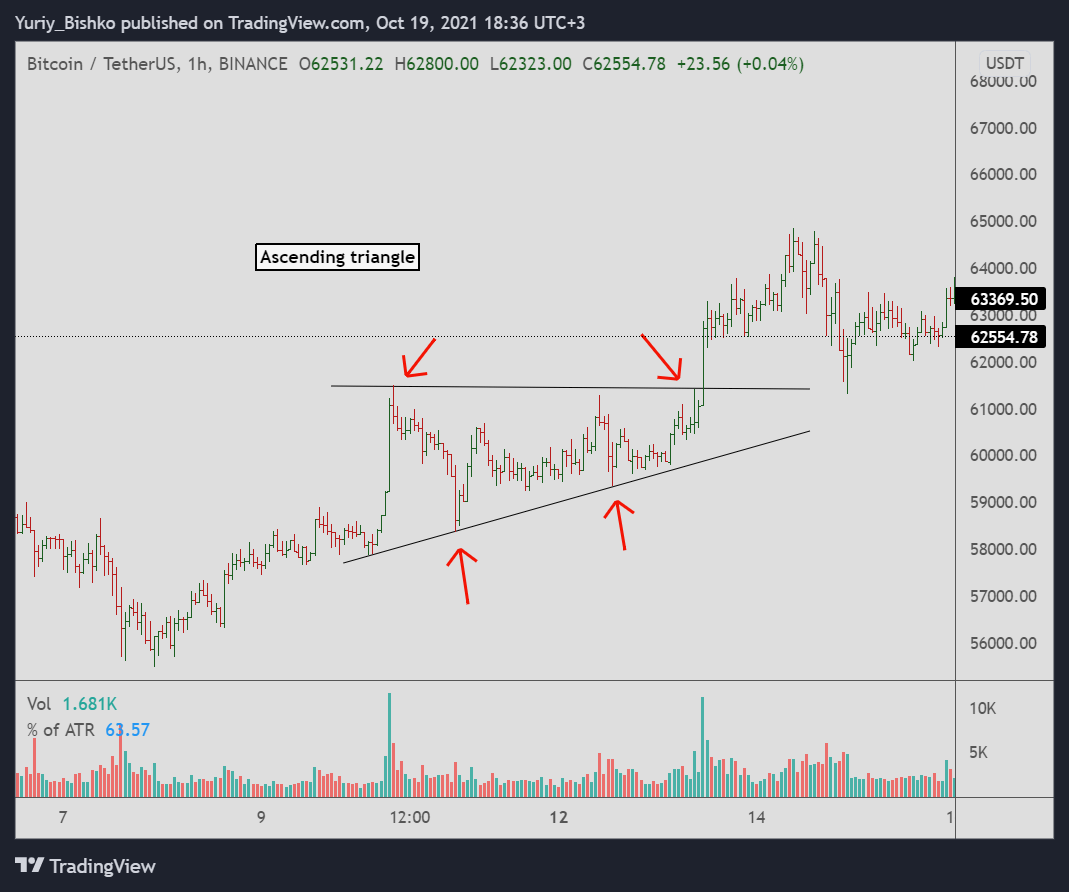
Ascending triangle
Ascending triangle- next in the list of triangles. The main difference is that the top line of such a triangle is horizontal. The lower limit is the upward trend line. Unlike a symmetrical triangle, which is quite neutral and almost always serves as a continuation of the trend, the ascending triangle is a bullish structure and in the vast majority of cases there is a breakout. Such a triangle is formed more often during the upward trend and serves as its continuation. The structure ends with a breakout of the upper line.
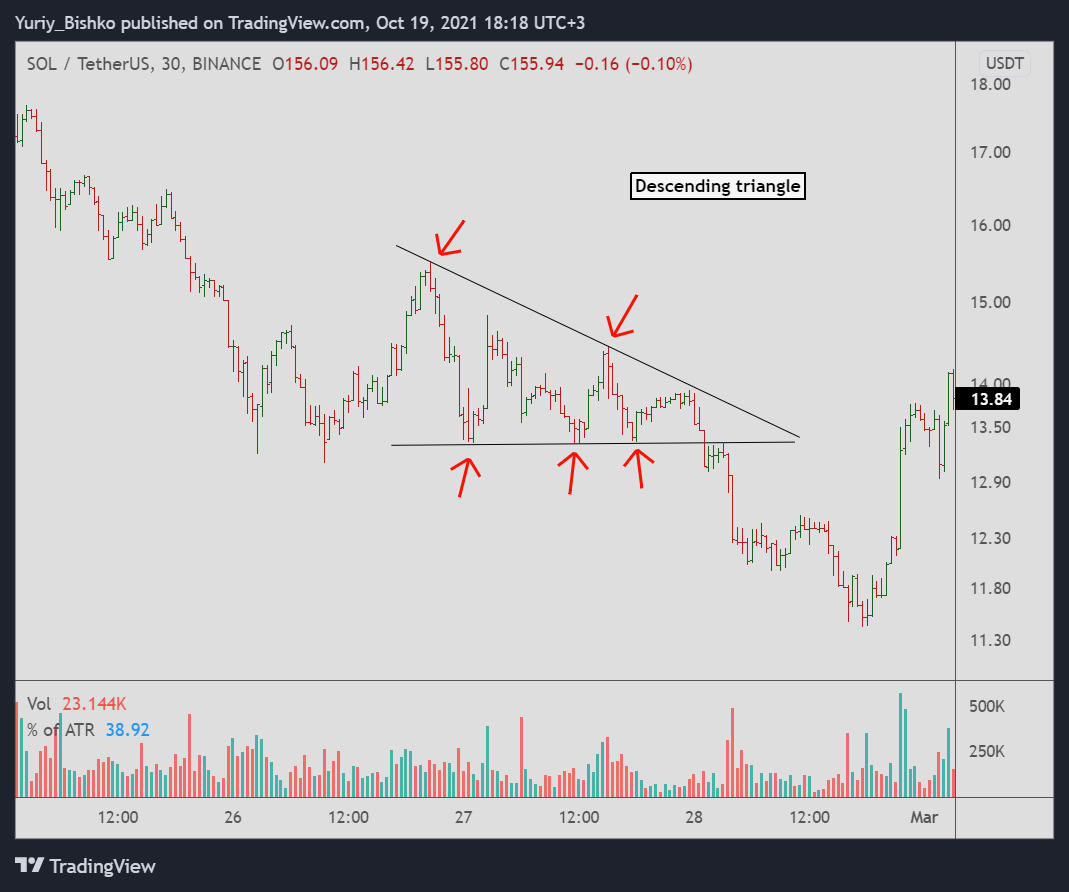
Descending triangle
Descending triangle - a formation opposite to the ascending triangle. In this case, the horizontal bottom line, and the top - is a downward trend line. In most cases, it is a bearish structure that breaks down. Traders often watch for signs of decreasing buying pressure and increasing selling pressure within this triangle trading pattern, anticipating a breakout to the downside. Confirmation of a breakdown is typically accompanied by a significant increase in trading volume, signaling a potential continuation of the downward trend in the crypto market.
Triangle trading patterns are commonly observed in crypto trading charts and are formed by converging trendlines, indicating a period of consolidation before a potential breakout or breakdown. Traders often watch for the breakout or breakdown from these triangles, accompanied by increased volume, to confirm potential trends and make informed trading decisions in the volatile crypto markets.
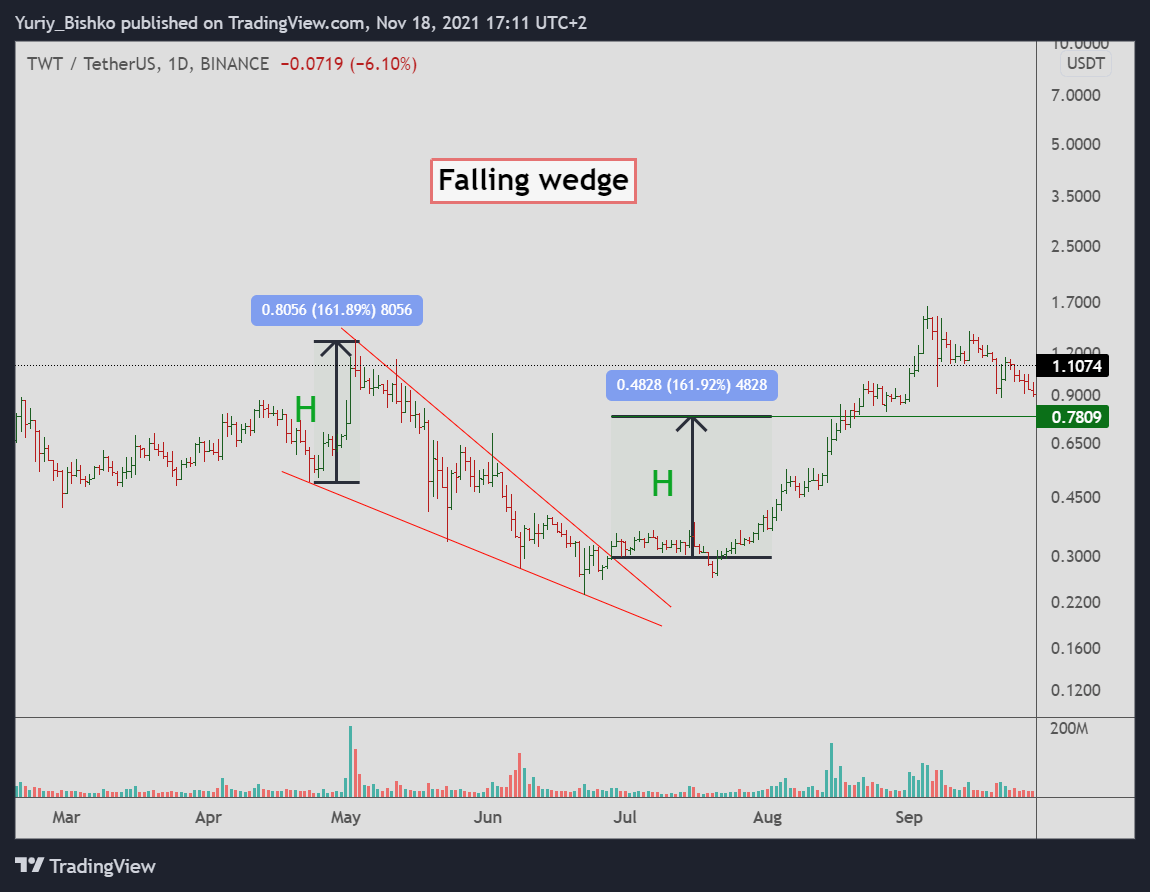
Falling wedge
Falling wedge – a bullish figure that is formed in a downward trend and serves as a guide for a possible reversal of the trend and the transition to correction, or upward trend. Resistance and support levels are directed downwards, and the breakout of the model usually occurs upwards.
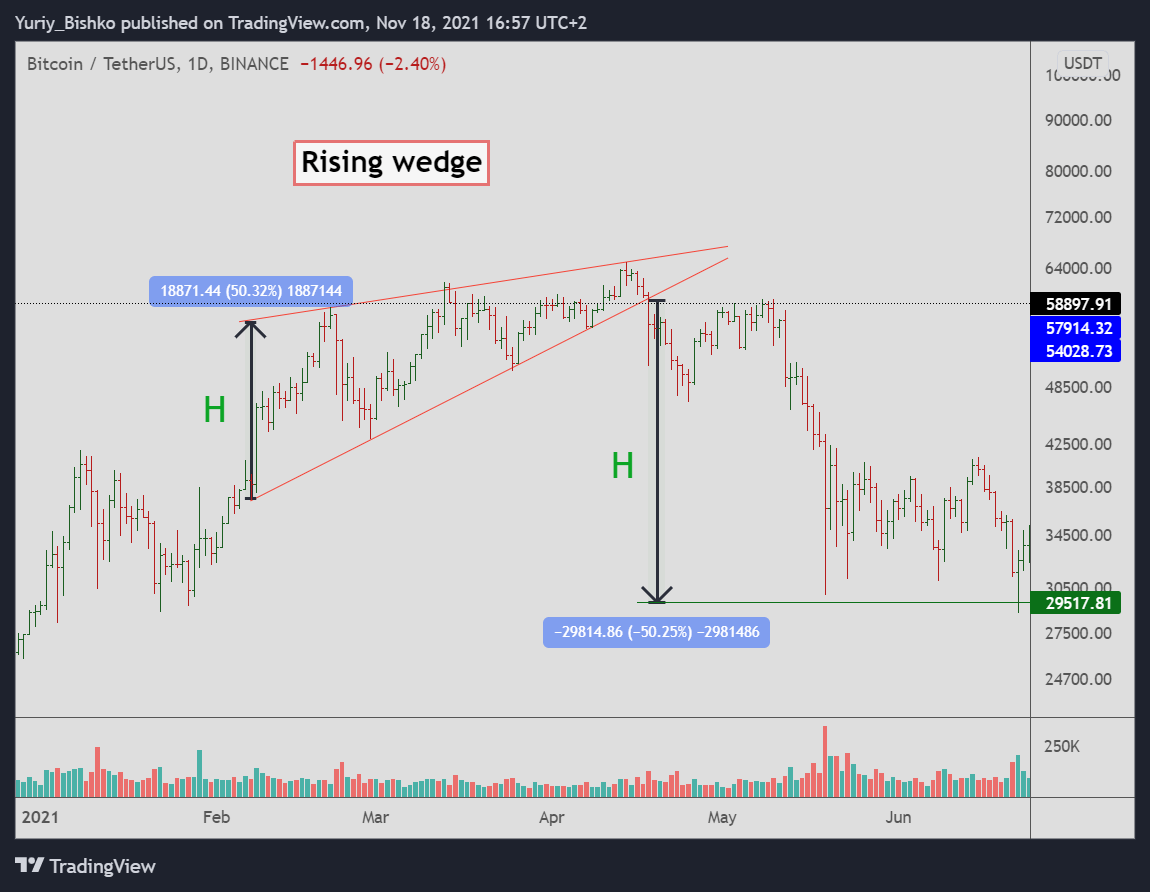
Rising wedge
Rising wedge - a bearish figure that is formed during an upward trend, thus suggesting a correction or a downward trend. Resistance and support levels are directed upwards, and the breakout of the model usually occurs downwards.
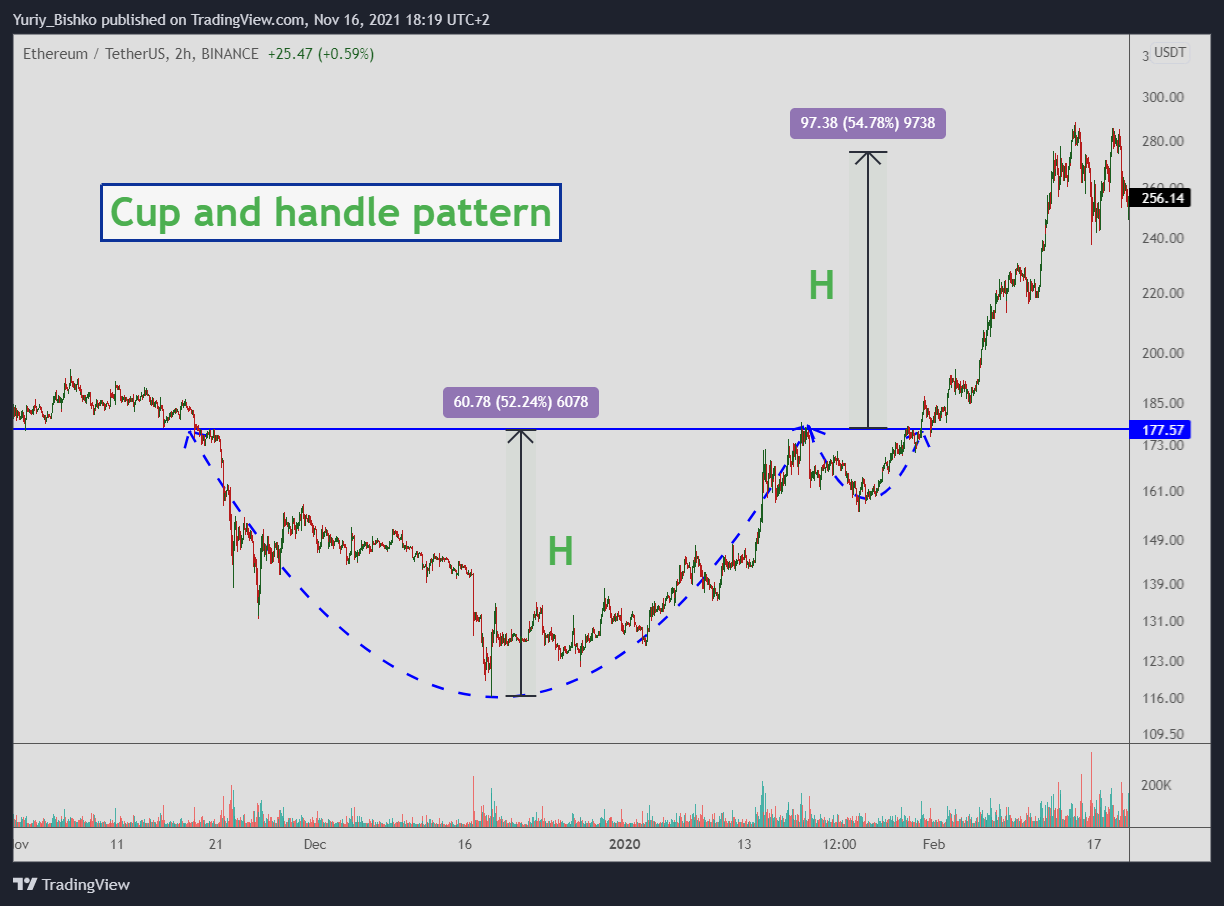
Cup and handle
Cup and handle – this term was chosen because of the similarity between this type of utensil and what the trader sees on the chart. The figure in the technical analysis is considered to be a model of trend continuation. It is usually formed in the middle of an uptrend or downtrend and looks like a correction zone consisting of two elements: an arc that looks like a cup and a short drop zone that looks like a handle. In the process of forming the figure, maxima are formed, connecting which we obtain the level of resistance (upper limit of the cup). In the event of a breakout and consolidation above the resistance line, the upward trend continues.
There is also a bear model, the appearance of which is characteristic of the downward trend, which is called an inverted cup and handle
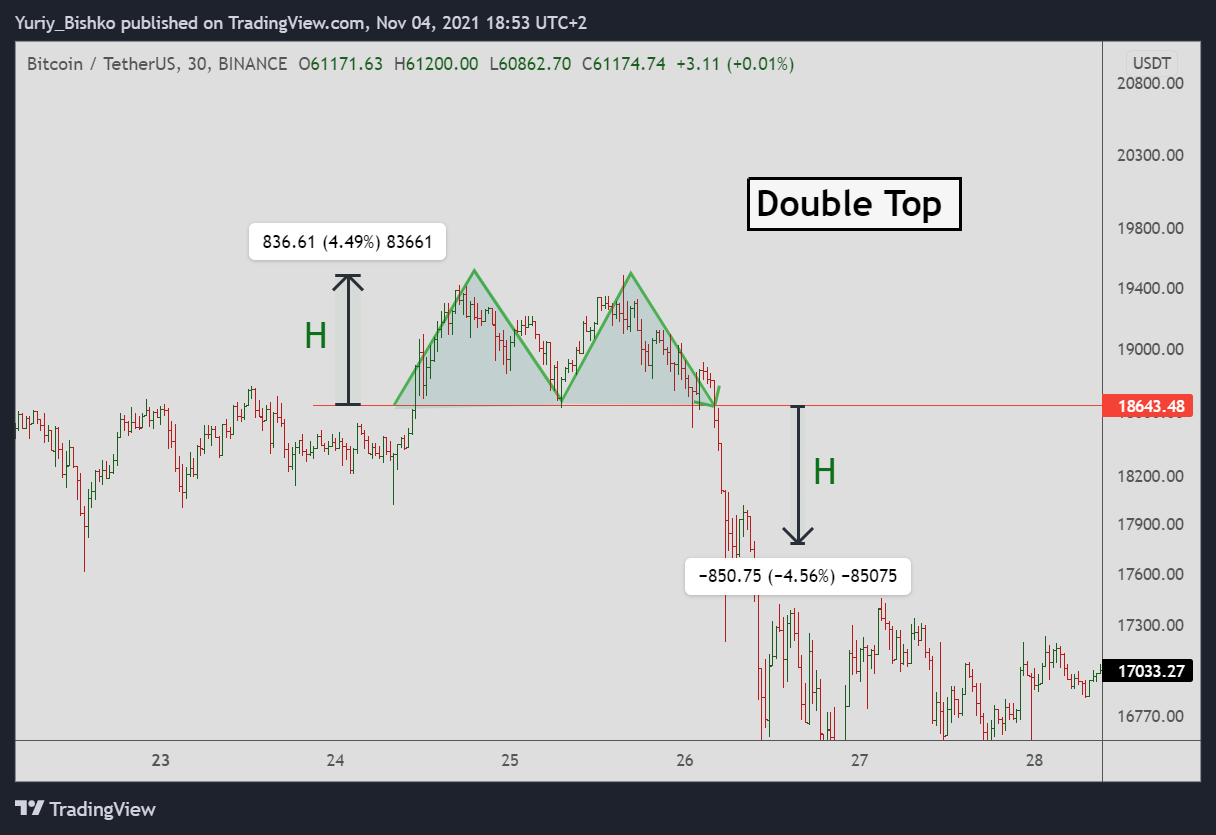
Double top
Double top - a bearish reversal pattern that signals the end of an uptrend. The figure is formed by two price maxima, which are formed at the same level, and the cut line, which acts as a local support. Traders wait for the price to break the support line, then open the short position.
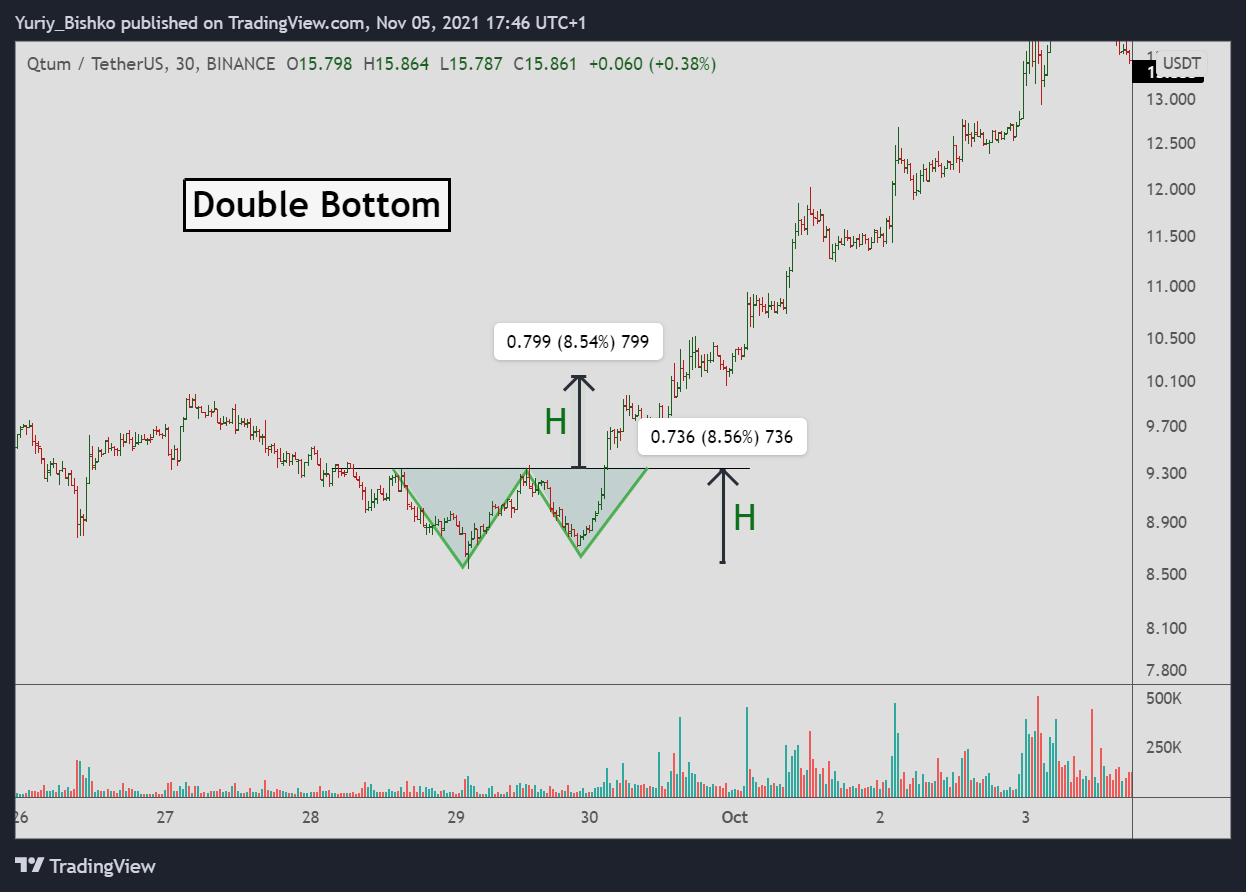
Double bottom
Double bottom - a bullish reversal structure that works on the same model as the double top, but in the opposite direction and signals the end of the downward trend. The figure is formed by two price minima, which are formed at the same level, and the cut line, which acts as a resistance. Traders wait for the price to break the resistance line, then open long positions.
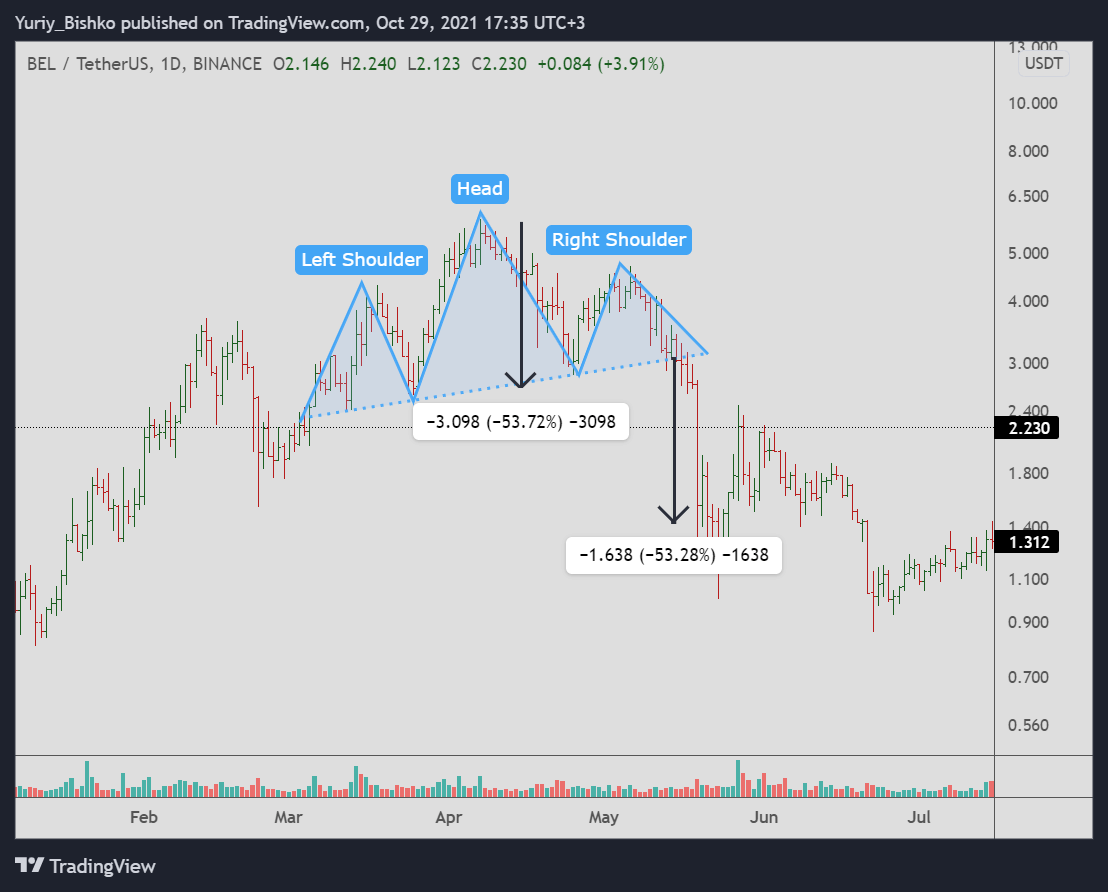
Head and shoulders
Head and shoulders - the figure is rarely seen on the chart in its pure form. In general, the pattern is considered a reversible formation. The head and shoulders consist of three consecutive vertices, the middle and highest vertex - the head, the other two - the shoulders, they are lower and approximately equal. Below all three vertices, there is also a support line called the neck. Traders wait for the price to breakout the support line (neck), then open short positions.
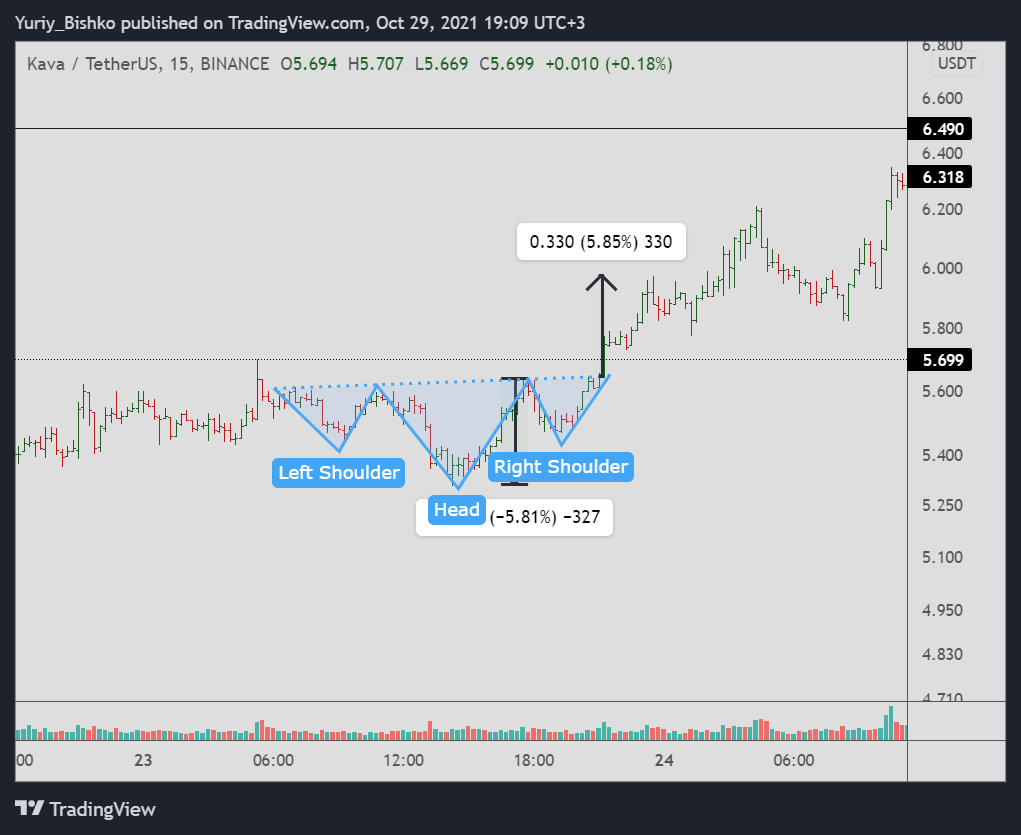
Inverse head and shoulders
Inverse head and shoulders - the figure works on the same model as the normal head and shoulders, but in the opposite direction, the structure usually occurs at the end of the downward trend, and signals the end of the downward trend and the transition to the growth phase. During the trading of this formation, traders wait for the breakout of the resistance line (neck), and then open long positions.
Range
Range - trading range in which the price of the asset moves only in the lateral direction, without any significant increase up or down. During the range, the price movement is limited to certain levels. You may also have heard of three market stages: ascending, descending, and sideways. If everything is clear with the first two, then the sideways stage is actually consolidation or as it is also called the trading range. Traders usually trade a breakout of the trading range.
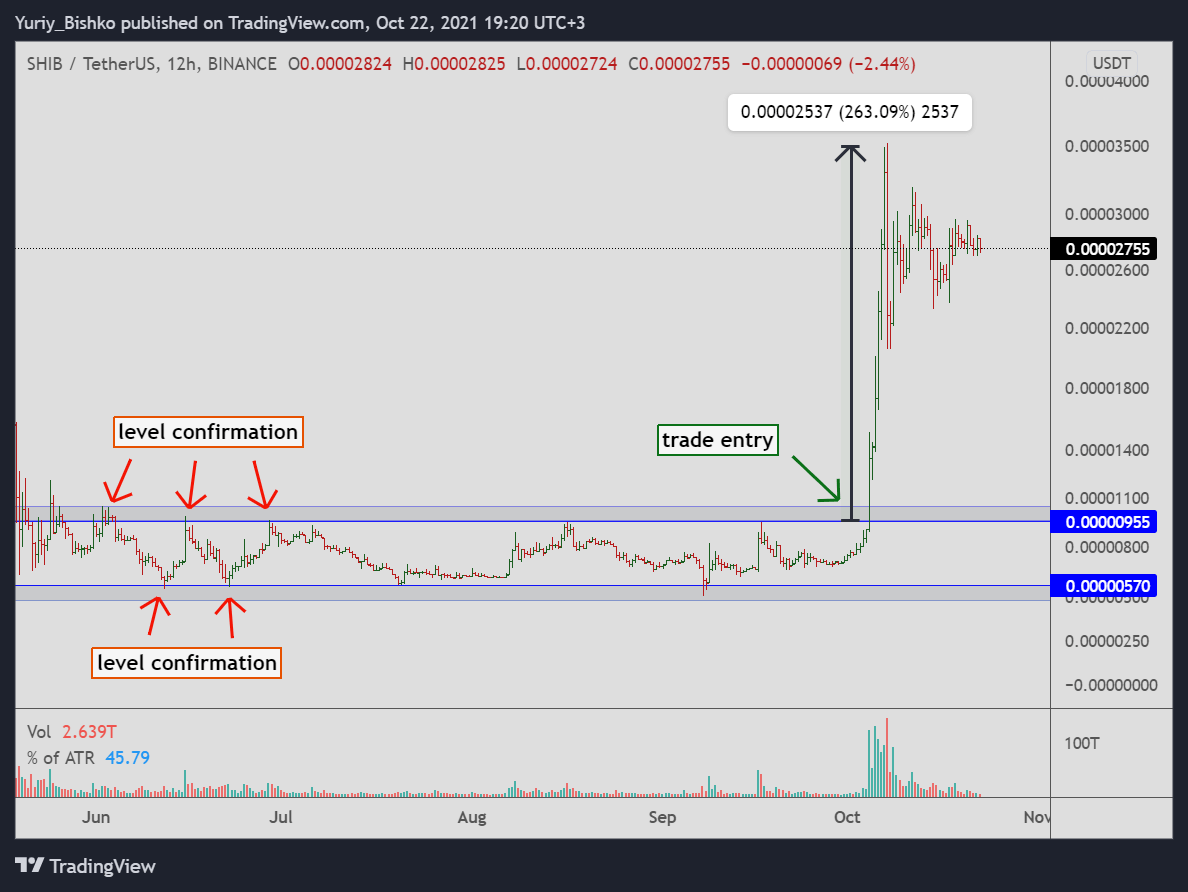
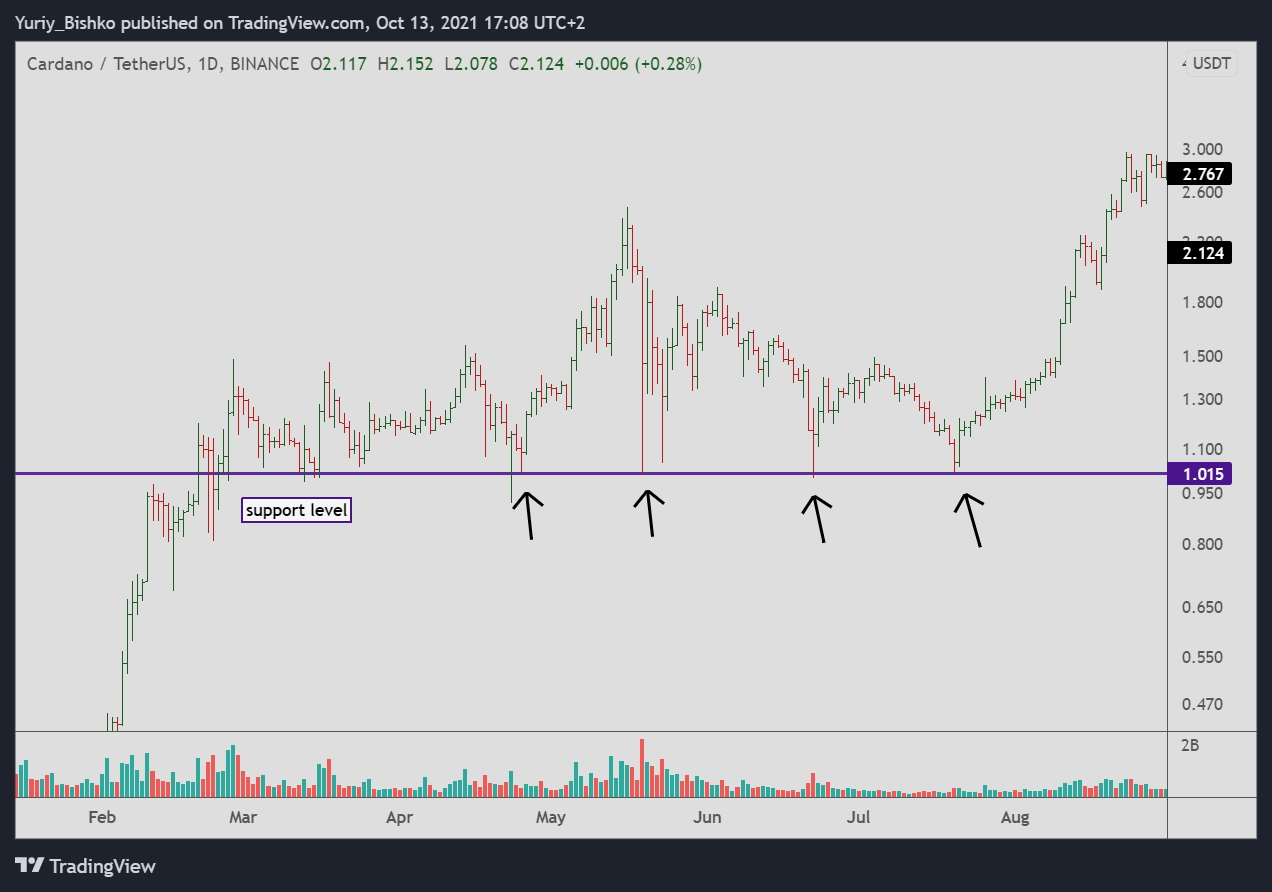
Support and resistance levels
Support and resistance levels - important price points to which the price responds. Levels are considered to be the basis of technical analysis, on their basis quite a lot of trading systems are built and all the main patterns that we have presented above. Levels appear in places where the strength of market participants comes into balance and does not have the strength to continue its movement, usually at these points the price stops and turns in the opposite direction.
Do chart patterns work in trading?
Yes, the chart patterns work in trading and, probably, 99% of traders started trading with chart patterns. But if you really want to make money, as a trader with 8 years of experience, I recommend you to use MORE than just patterns in trading.
Friends, in almost all of my pattern trades I use additional confirmation from another source. The point is that you need to get multiple confirmations to buy or sell crypto, combine your approaches to get more accurate signals and increase your trading profits. Relying solely on crypto trading patterns might not always provide sufficient insight, as market conditions can vary widely, necessitating a multifaceted approach to achieve consistent profitability.
For example, when you are planning a vacation you check the weather on 2 or 3 different websites. When you search for a new phone model, you look at YouTube videos on 2 channels or on 2 different platforms. All the same in trading.
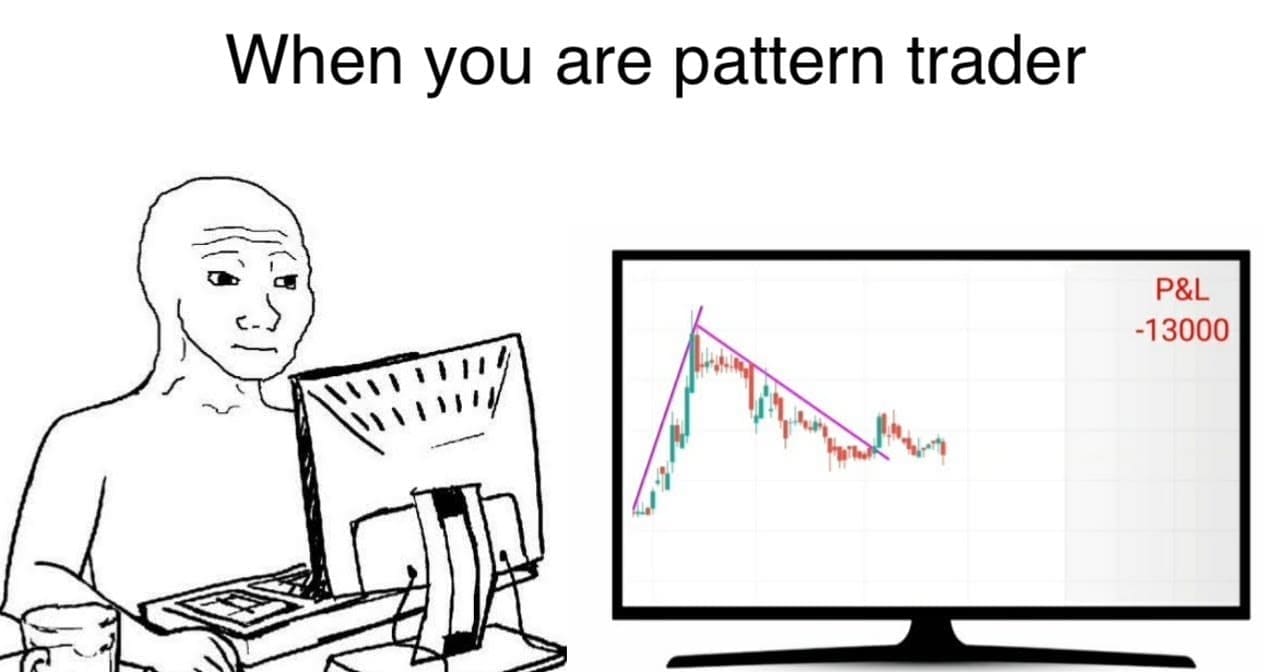
This meme shows the truth about clear chart pattern trading. This shows what the trader got by simply trading patterns without any additional confirmations.
Such confirmation for me are the orders by the big players. The big players have more information from the market, they have dozens of analysts. If a player or fund want to buy 1000 Bitcoins, the DOM and Footprint indicators will show the buy orders.
If you open a trade using the pattern and see on the DOM and Footprint indicators that a big player is also opening a trade with you, this is a double confirmation, which gives you a 50% higher chance for success. In trading, success is the gained profit.
Video instruction on how to use DOM and Footprint:
- What is DOM
- What is Footprint
- The real trades with these tools
Dom and Footprint ! Prediction of BTC movements with 90% accuracy with DOM and Footpint
Summary
In this article, you learned about the basic structures and patterns of technical analysis today. In order to fully understand the meaning of each formation, stop losing and start earning, go to the page of each pattern and read them in more detail.
Tired of endless crypto research? Get ahead with Buy/Sell Crypto Alerts! This exclusive program is your one-stop shop for maximizing your crypto gains. We bring together the power of expert signals, hidden gem discovery, and a supportive community to eliminate the guesswork from your crypto journey.